Python OpenCV Juggle Counter
- Introduction
- Getting Started and Adding a Color Slider
- Apply Thresholds by Color and Transformations
- Create Contours and Acquire Centroids
- Keep Track of Centroids
- Counting Objects
- Finishing Touches
- Plotting the Data
- Cautions
- Known Issues
Introduction
This project will use Python and the OpenCV library to keep track of objects being juggled. I will also be using the NumPy, Matplotlib, and Pandas libraries for this tutorial so please be sure to have those installed along with OpenCV. This tutorial is based off of the Python OpenCV Traffic Counter tutorial and will use a lot of the same code from that tutorial. I will only be going over sections of this script which are different from that tutorial. The Python code can be downloaded from my GitHub page. The source video file section I used for this tutorial is from Juggling 3 balls.
Getting Started and Adding a Color Slider
As mentioned before, this tutorial will use a lot of the same code from the Python OpenCV Traffic Counter tutorial and I will only go over sections of this script which differ from that tutorial. This tutorial does not use the background subtractor cv2.createBackgroundSubtractorMOG2() as it captures the moving arms of the juggler. Instead, we will acquire the objects that are being juggled by filtering them with a color threshold using cv2.inRange() later on in the code. This different method is used because the objects are a distinct color and can be tracked easily.
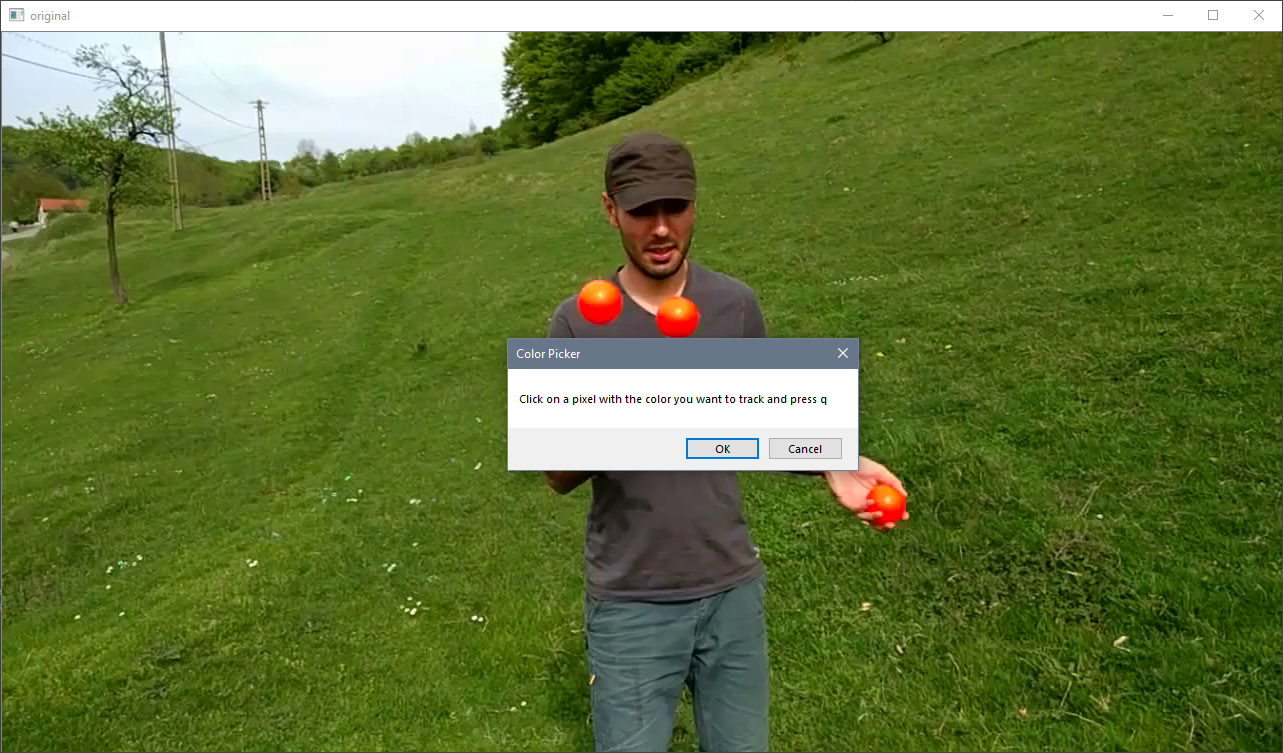
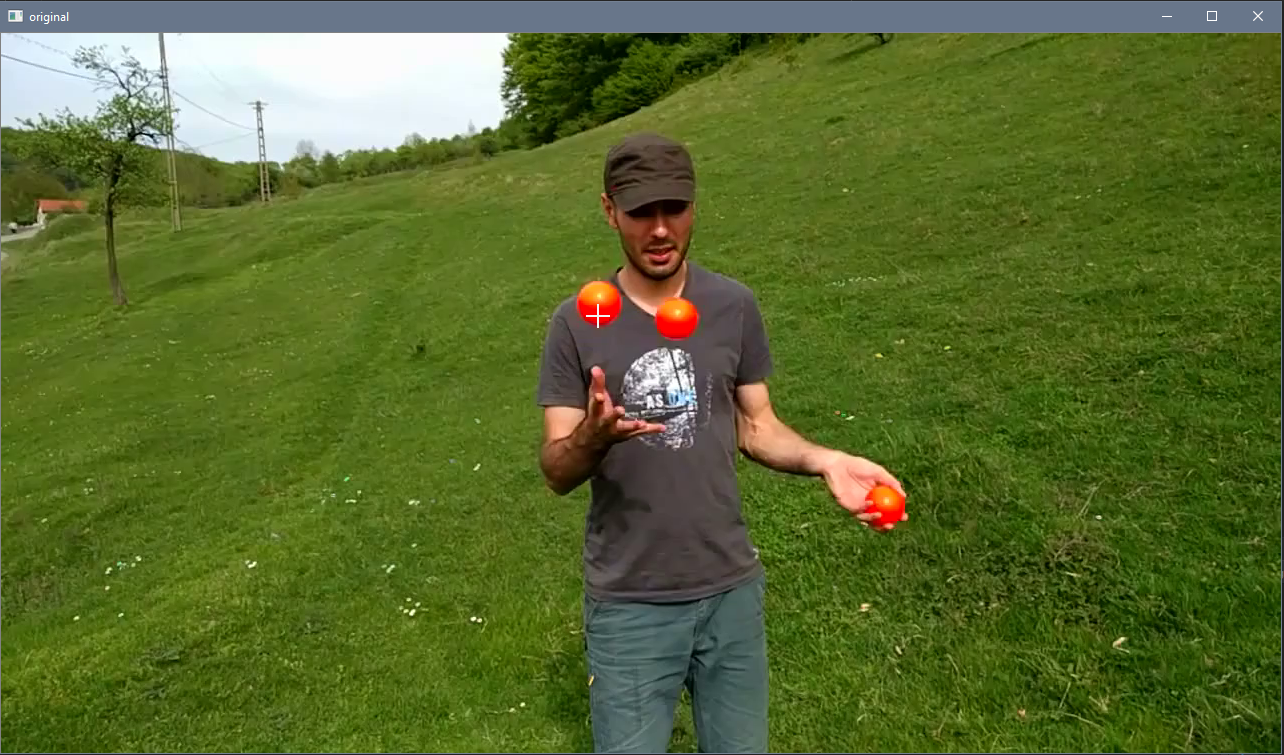
Line 4 imports a library which is used briefly to display a message box on screen. Lines 23 and 24 open up the first frame of the image in order to allow the user to select a color they want to track. Lines 27-31 create the function which allows the user to click on a pixel and acquire its color values. Line 29 contains the BGR color values, line 30 creates a global variable to be used outside the function, and line 31 converts the BGR colors to HSV colors to better isolate the desired objects. Here is a link which talks about the HSV colorspace. Lines 35-37 prompt the user to pick a desired color from the frame loaded earlier. Line 39-41 allows the user to close the frame by pressing any key.
Now that the colors have been chosen, a color slider can be created to adjust the colors as desired. Lines 45-64 create a trackbar with multiple sliders based off of the Trackbar as the Color Palette tutorial. The hsvrange variable on line 53 can be adjusted to cover a greater or lesser range of HSV colors. Lines 55-60 provide the default slider value based off of the chosen color which can be adjusted as the video plays. Lines 76-82 acquire the position of the sliders as the video progresses in order to update the HSV color range.
import numpy as np
import cv2
import pandas as pd
import ctypes  # for message box

cap = cv2.VideoCapture('juggle.mp4')
frames_count, fps, width, height = cap.get(cv2.CAP_PROP_FRAME_COUNT), cap.get(cv2.CAP_PROP_FPS), cap.get(
    cv2.CAP_PROP_FRAME_WIDTH), cap.get(cv2.CAP_PROP_FRAME_HEIGHT)
width = int(width)
height = int(height)
print(frames_count, fps, width, height)

# creates a pandas data frame with the number of rows the same length as frame count
df = pd.DataFrame(index=range(int(frames_count)))
df.index.name = "Frames"

framenumber = 0  # keeps track of current frame
carscrossedup = 0  # keeps track of cars that crossed up
carscrosseddown = 0  # keeps track of cars that crossed down
carids = []  # blank list to add car ids
totalcars = 0  # keeps track of total cars

ret, frame = cap.read()  # captures first frame in order to be able to click on color for color range
cv2.imshow("original", frame)


def color_picker(event, x, y, flags, param):  # function to click on pixel and get color range
    if event == cv2.EVENT_LBUTTONDOWN:
        bgr = np.uint8([[frame[y, x]]])  # bgr color code
        global hsvcolors  # global so it can be accessed later on
        hsvcolors = np.array(cv2.cvtColor(bgr, cv2.COLOR_BGR2HSV))  # convert bgr colors to hsv


# color picker sequence
ctypes.windll.user32.MessageBoxW(0, "Click on a pixel with the color you want to track and press any key", "Color Picker", 1)
cv2.namedWindow('original')
cv2.setMouseCallback('original', color_picker)

k = cv2.waitKey(0) & 0xff  # close color picker screen by pressing any key
if k == 27:
    print('next')


# creates an hsv color slider
def nothing(x):
    pass


# Create a black image, a window
img = np.zeros((1, 600, 3), np.uint8)
cv2.namedWindow('HSV Color Slider')

hsvrange = 30
# create trackbars for HSV Color Slider
cv2.createTrackbar('H Lower', 'HSV Color Slider', hsvcolors[0][0][0] - hsvrange, 179, nothing)
cv2.createTrackbar('S Lower', 'HSV Color Slider', hsvcolors[0][0][1] - hsvrange, 255, nothing)
cv2.createTrackbar('V Lower', 'HSV Color Slider', hsvcolors[0][0][2] - hsvrange, 255, nothing)
cv2.createTrackbar('H Upper', 'HSV Color Slider', hsvcolors[0][0][0] + hsvrange, 179, nothing)
cv2.createTrackbar('S Upper', 'HSV Color Slider', hsvcolors[0][0][1] + hsvrange, 255, nothing)
cv2.createTrackbar('V Upper', 'HSV Color Slider', hsvcolors[0][0][2] + hsvrange, 255, nothing)

# create switch for ON/OFF functionality
switch = '0 : OFF \n1 : ON'
cv2.createTrackbar(switch, 'HSV Color Slider', 0, 1, nothing)

# information to start saving a video file
ret, frame = cap.read()  # import image
ratio = .5  # resize ratio
image = cv2.resize(frame, (0, 0), None, ratio, ratio)  # resize image
width2, height2, channels = image.shape
video = cv2.VideoWriter('juggle_counter.avi', cv2.VideoWriter_fourcc('M', 'J', 'P', 'G'), fps, (height2, width2), 1)

while True:  # for video feeds

    # acquire current positions of trackbars
    hl = cv2.getTrackbarPos('H Lower', 'HSV Color Slider')
    sl = cv2.getTrackbarPos('S Lower', 'HSV Color Slider')
    vl = cv2.getTrackbarPos('V Lower', 'HSV Color Slider')
    hu = cv2.getTrackbarPos('H Upper', 'HSV Color Slider')
    su = cv2.getTrackbarPos('S Upper', 'HSV Color Slider')
    vu = cv2.getTrackbarPos('V Upper', 'HSV Color Slider')
    s = cv2.getTrackbarPos(switch, 'HSV Color Slider')

    if s == 0:  # closing window if switch slider is set to 0
        img[:] = 0

    ret, frame = cap.read()  # import image

    if ret:

        image = cv2.resize(frame, (0, 0), None, ratio, ratio)  # resize image
Pick Color
Pick Color 2
Apply Thresholds by Color and Transformations
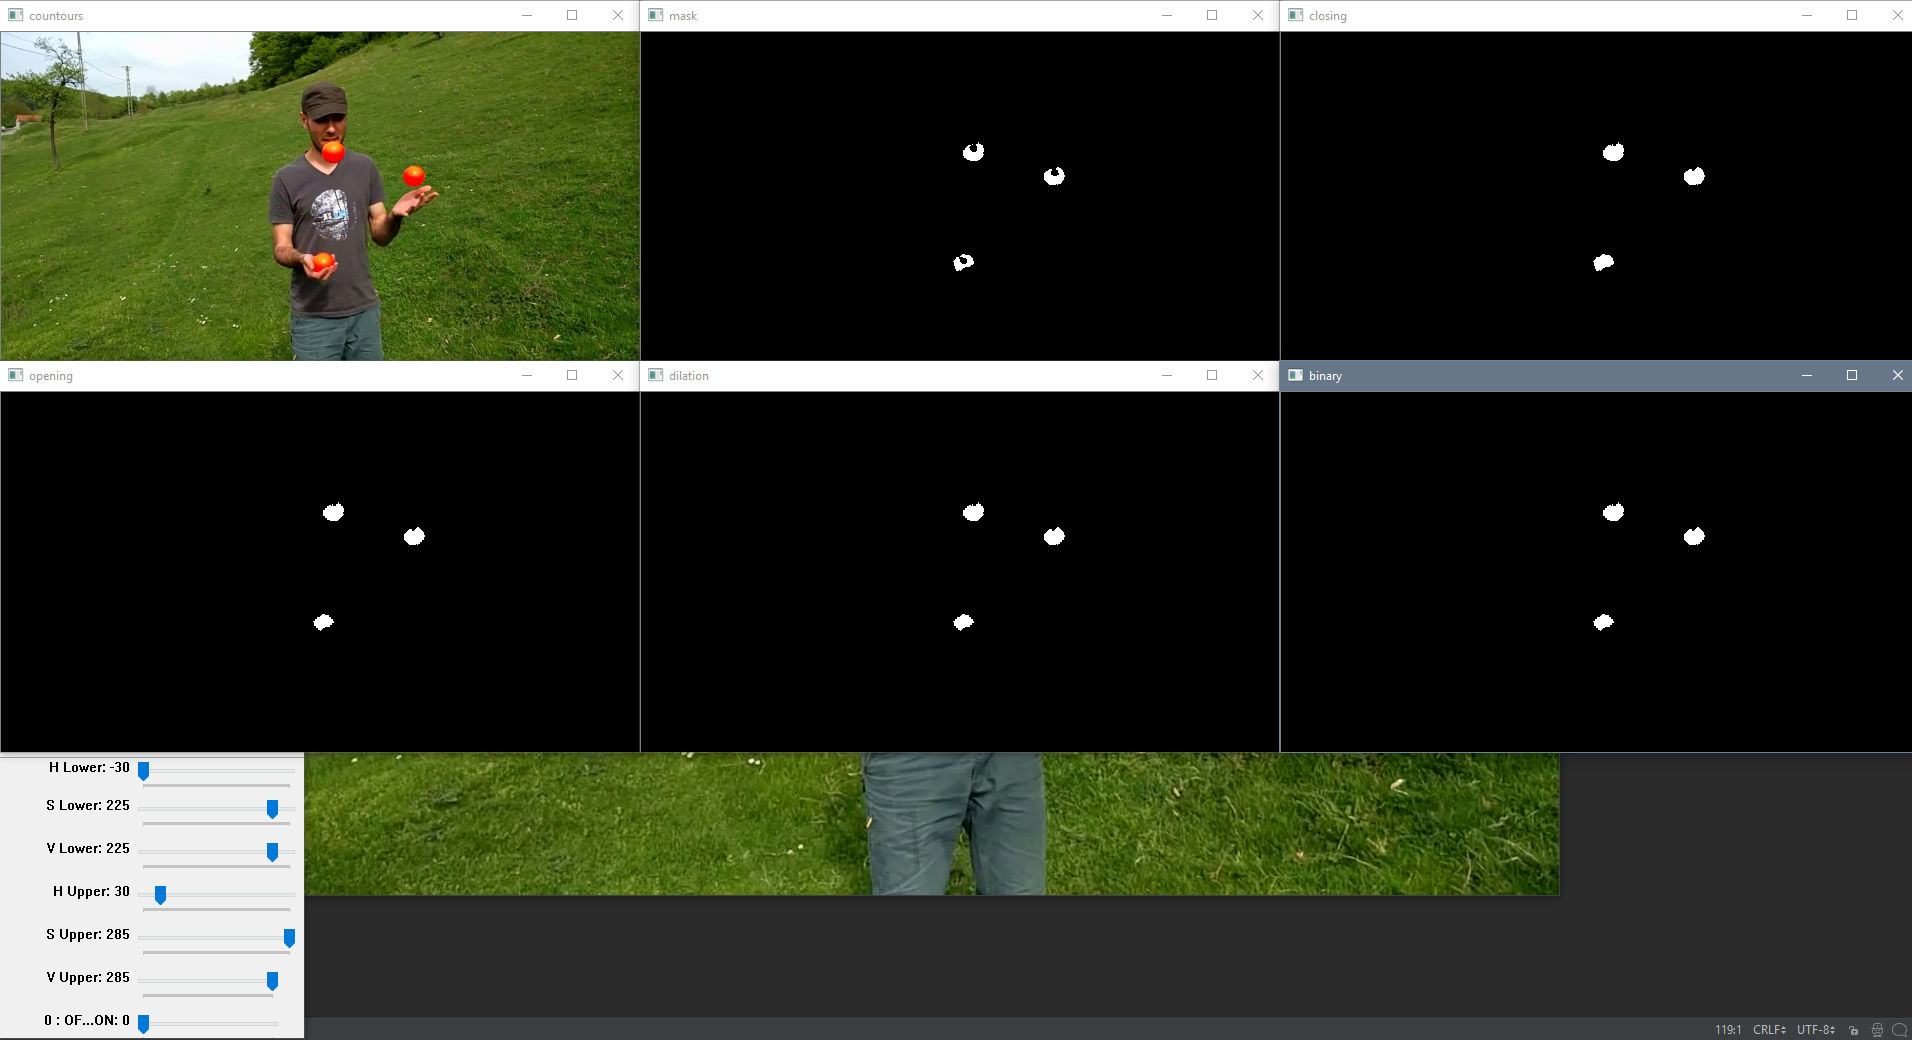
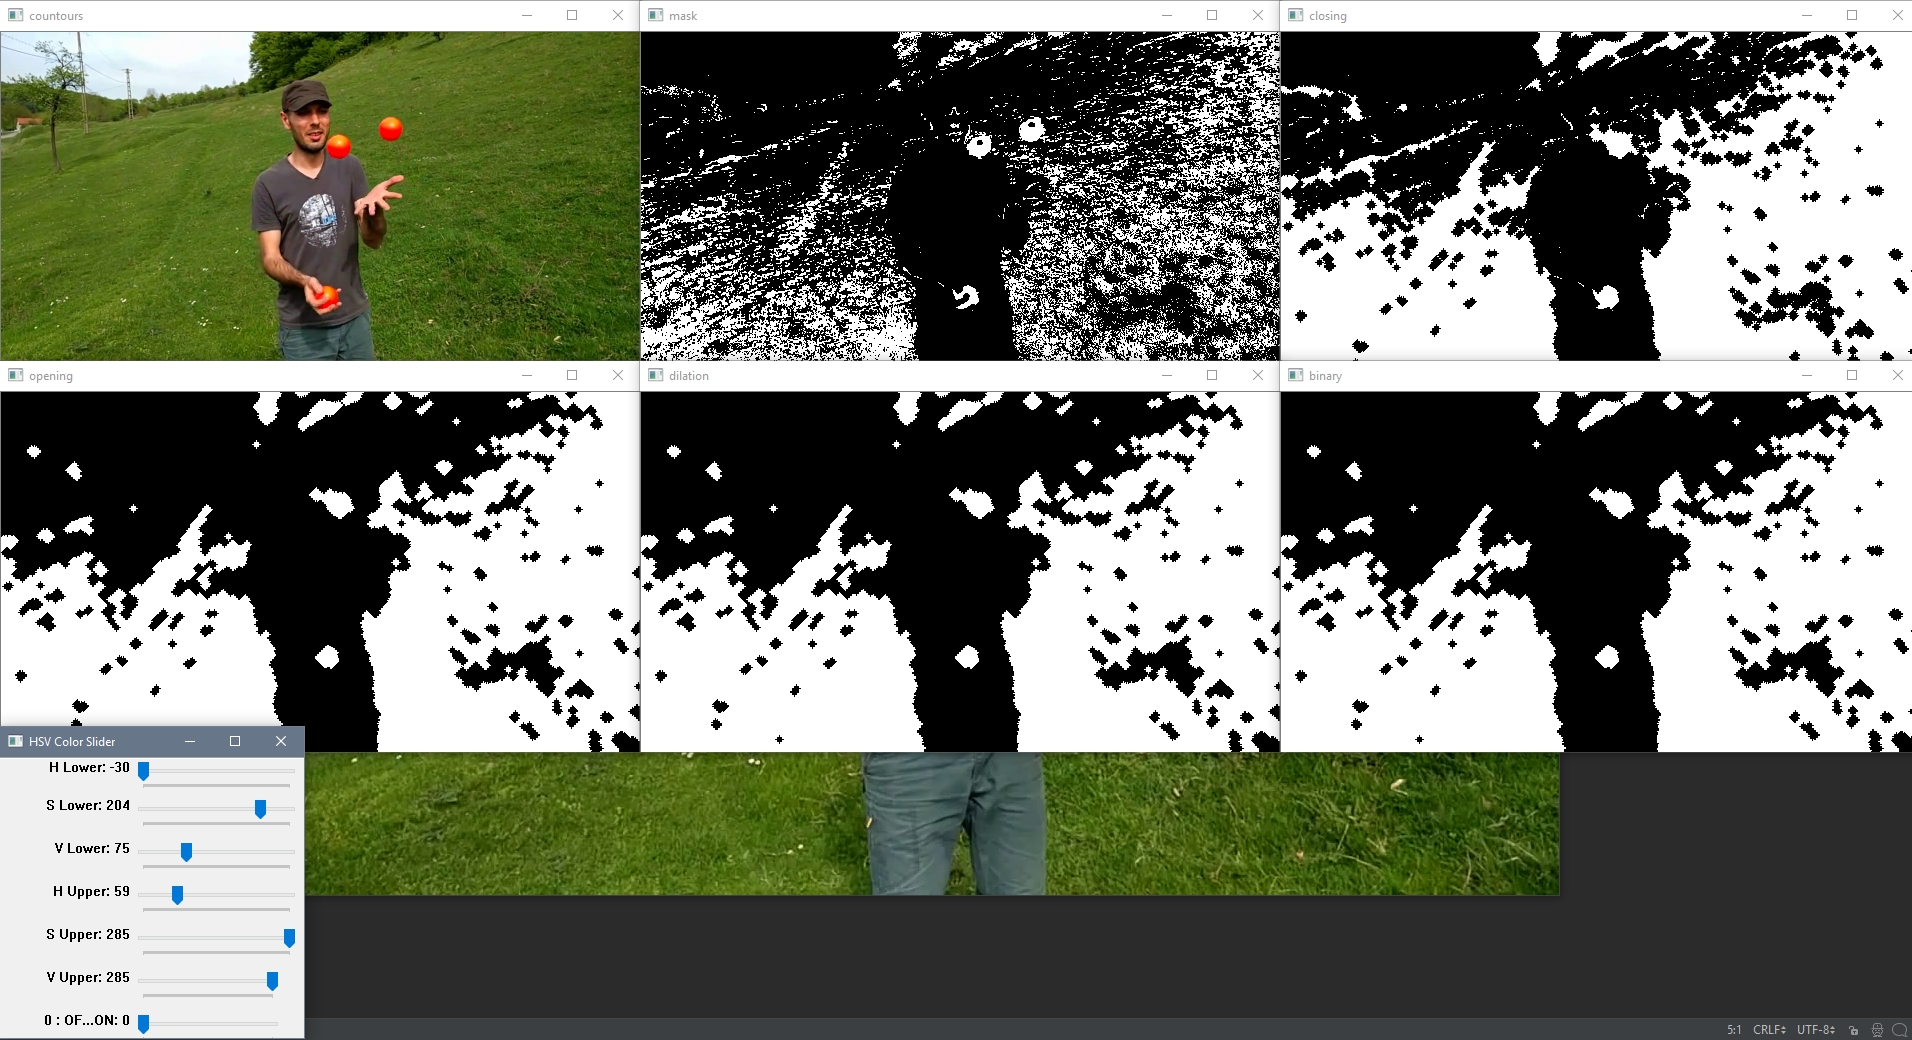
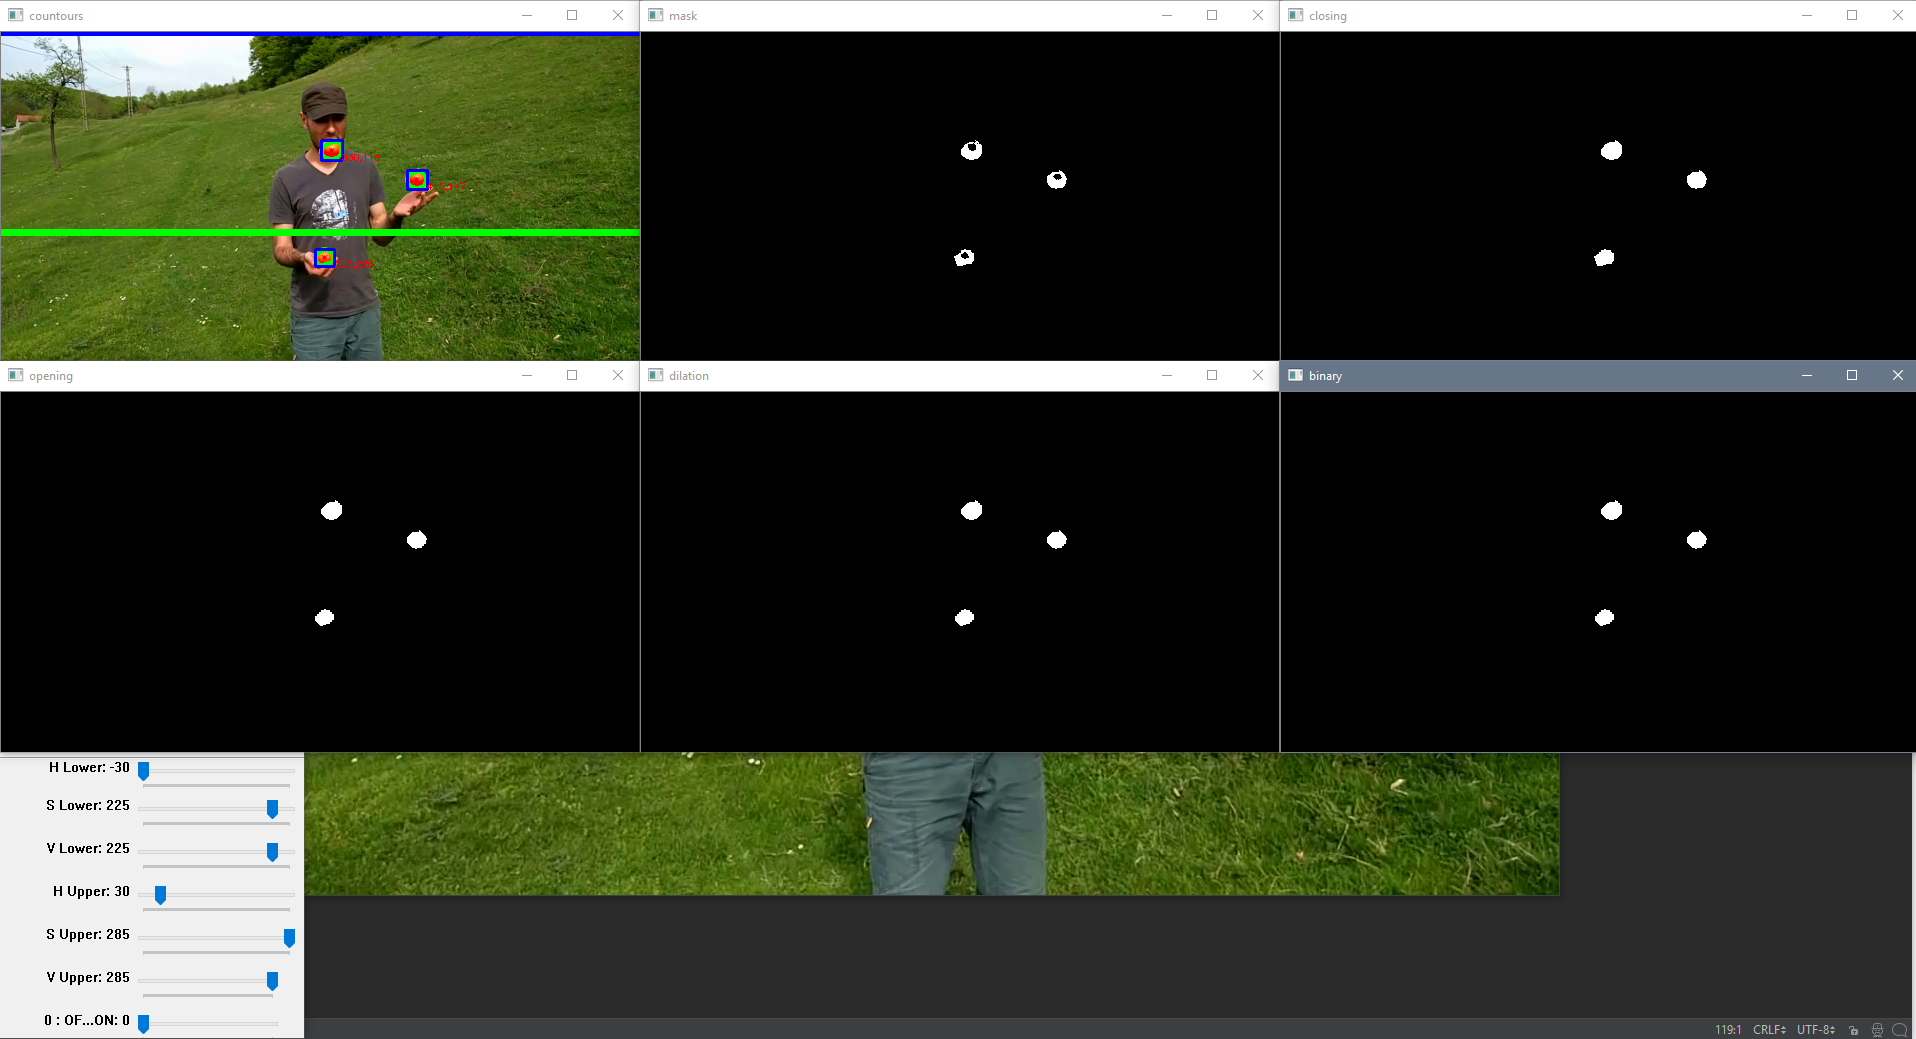
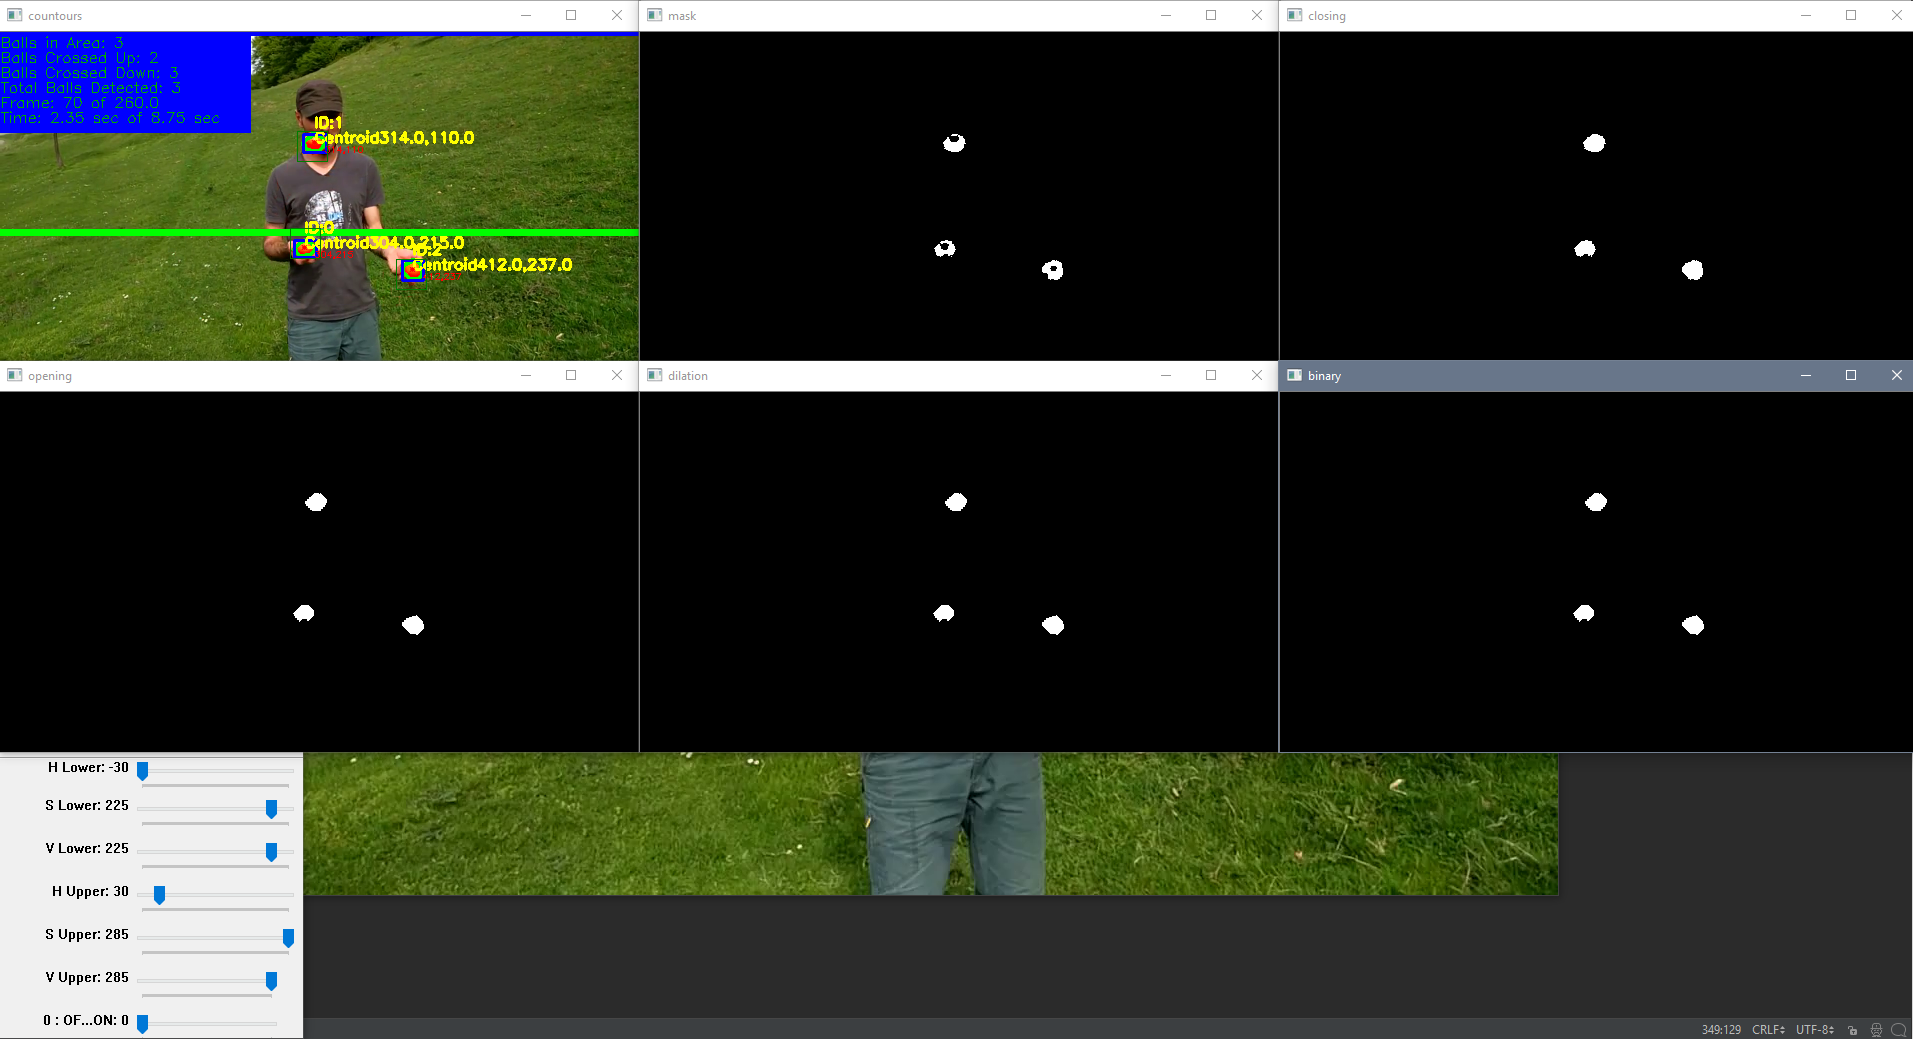
As mentioned above, the background subtractor cv2.createBackgroundSubtractorMOG2() will not be used for this video since it will capture the juggler's moving arms. Instead, we will acquire the desired objects using a color threshold. Line 93 converts the image frame to the HSV colorspace in order to be able to extract the desired objects. Line 96 and 97 acquire the HSV color bounds from the slider in order to apply them to the color threshold using cv2.inRange() in line 100. Line 101 displays only the objects in the frame but is not displayed below. The rest of the lines apply different transformations in order to extract the objects into more distinguishable shapes. The second image below is an adjusted color slider that produces a lot more objects than the ones we want. Selecting the correct color range is essential in acquiring the desired objects.
        hsv = cv2.cvtColor(image, cv2.COLOR_BGR2HSV)  # convert image to HSV for filtering

        # lower and upper bound of hsv colors that are acceptable
        lower_bound = np.array([hl, sl, vl])
        upper_bound = np.array([hu, su, vu])

        # creates mask for HSV colors between the lower and upper bound
        mask = cv2.inRange(hsv, lower_bound, upper_bound)
        res = cv2.bitwise_and(image, image, mask=mask)

        # applies different thresholds to mask to try and isolate cars
        # just have to keep playing around with settings until cars are easily identifiable
        kernel = cv2.getStructuringElement(cv2.MORPH_CROSS, (5, 5))
        closing = cv2.morphologyEx(mask, cv2.MORPH_CLOSE, kernel, iterations=2)
        opening = cv2.morphologyEx(closing, cv2.MORPH_OPEN, kernel, iterations=2)
        dilation = cv2.dilate(opening, kernel, iterations=0)
        retvalbin, bins = cv2.threshold(dilation, 220, 255, cv2.THRESH_BINARY)
Color Slider
Color Slider Updated
Create Contours and Acquire Centroids
This section of the code is identical to the Python OpenCV Traffic Counter: Create Contours and Acquire Centroids section except the position of the lineypos line. We have moved the lineypos line (the blue line) to the top of the frame so the if statement in line 152 captures all the contours on the screen since the objects being juggled traverse the whole screen and are still easily distinguishable. The purpose of this section is to filter out contours that are not parent contours, within a certain size, and a certain location. More information on this section can be found in the tutorial section mentioned above.
        # creates contours
        im2, contours, hierarchy = cv2.findContours(bins, cv2.RETR_TREE, cv2.CHAIN_APPROX_SIMPLE)

        # use convex hull to create polygon around contours
        hull = [cv2.convexHull(c) for c in contours]

        # draw contours
        cv2.drawContours(image, hull, -1, (0, 255, 0), 3)

        # line created to stop counting contours, needed as cars in distance become one big contour
        lineypos = 0
        cv2.line(image, (0, lineypos), (width, lineypos), (255, 0, 0), 5)

        # line y position created to count contours
        lineypos2 = 200
        cv2.line(image, (0, lineypos2), (width, lineypos2), (0, 255, 0), 5)

        # min area for contours in case a bunch of small noise contours are created
        minarea = 20

        # max area for contours, can be quite large for busses
        maxarea = 1000

        # vectors for the x and y locations of contour centroids in current frame
        cxx = np.zeros(len(contours))
        cyy = np.zeros(len(contours))

        for i in range(len(contours)):  # cycles through all contours in current frame

            if hierarchy[0, i, 3] == -1:  # using hierarchy to only count parent contours (contours not within others)

                area = cv2.contourArea(contours[i])  # area of contour

                if minarea < area < maxarea:  # area threshold for contour

                    # calculating centroids of contours
                    cnt = contours[i]
                    M = cv2.moments(cnt)
                    cx = int(M['m10'] / M['m00'])
                    cy = int(M['m01'] / M['m00'])

                    if cy > lineypos:  # filters out contours that are above line (y starts at top)

                        # gets bounding points of contour to create rectangle
                        # x,y is top left corner and w,h is width and height
                        x, y, w, h = cv2.boundingRect(cnt)

                        # creates a rectangle around contour
                        cv2.rectangle(image, (x, y), (x + w, y + h), (255, 0, 0), 2)

                        # Prints centroid text in order to double check later on
                        cv2.putText(image, str(cx) + "," + str(cy), (cx + 10, cy + 10), cv2.FONT_HERSHEY_SIMPLEX,
                                    .3, (0, 0, 255), 1)

                        cv2.drawMarker(image, (cx, cy), (0, 0, 255), cv2.MARKER_STAR, markerSize=5, thickness=1,
                                       line_type=cv2.LINE_AA)

                        # adds centroids that passed previous criteria to centroid list
                        cxx[i] = cx
                        cyy[i] = cy

        # eliminates zero entries (centroids that were not added)
        cxx = cxx[cxx != 0]
        cyy = cyy[cyy != 0]
Contours and Centroids
Keep Track of Centroids
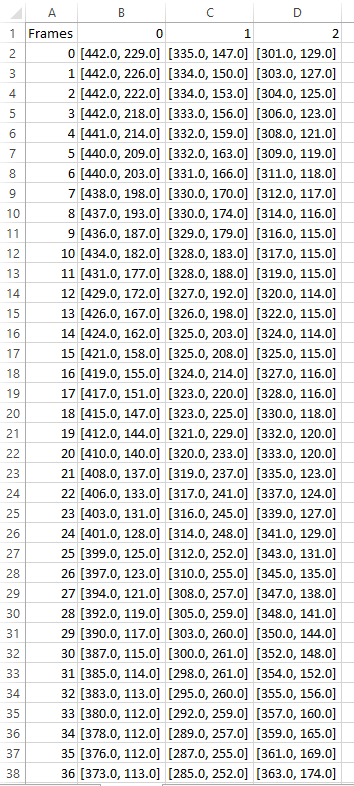
This section is identical to the Python OpenCV Traffic Counter: Keep Track of Centroids section. This section is responsible for keeping track of the moving objects and organizing their centroid location data in the dataframe created in line 14. The method I used for keeping track of the centroids is to check which centroid in the current frame was closest to a centroid in the previous frame. If a centroid in the current frame is not within the maximum radius allowable (line 181) of a centroid in the previous frame, then a new object to track is created. This tracking works great and issues only arise when centroids appear and disappear within the maximum allowable radius of other centroids. This was discussed in the Python OpenCV Traffic Counter: Known Issues section. An issue also occurs if objects move distances greater than the maximum radius allowable between frames. This causes an additional object to be created and can cause objects to conjoin with another object if it is within the maximum radius allowable of another object. More details about this issue will be discussed in the Known Issues section of this tutorial. An example of the dataframe CSV file saved at the end of the script can be seen below. More detailed information on how this tracking works can be seen in the link provided above.
        # empty list to later check which centroid indices were added to dataframe
        minx_index2 = []
        miny_index2 = []

        # maximum allowable radius for current frame centroid to be considered the same centroid from previous frame
        maxrad = 20

        # The section below keeps track of the centroids and assigns them to old carids or new carids

        if len(cxx):  # if there are centroids in the specified area

            if not carids:  # if carids is empty

                for i in range(len(cxx)):  # loops through all centroids

                    carids.append(i)  # adds a car id to the empty list carids
                    df[str(carids[i])] = ""  # adds a column to the dataframe corresponding to a carid

                    # assigns the centroid values to the current frame (row) and carid (column)
                    df.at[int(framenumber), str(carids[i])] = [cxx[i], cyy[i]]

                    totalcars = carids[i] + 1  # adds one count to total cars

            else:  # if there are already car ids

                dx = np.zeros((len(cxx), len(carids)))  # new arrays to calculate deltas
                dy = np.zeros((len(cyy), len(carids)))  # new arrays to calculate deltas

                for i in range(len(cxx)):  # loops through all centroids

                    for j in range(len(carids)):  # loops through all recorded car ids

                        # acquires centroid from previous frame for specific carid
                        oldcxcy = df.iloc[int(framenumber - 1)][str(carids[j])]

                        # acquires current frame centroid that doesn't necessarily line up with previous frame centroid
                        curcxcy = np.array([cxx[i], cyy[i]])

                        if not oldcxcy:  # checks if old centroid is empty for carid in case it is first time in frame

                            continue  # continue to next carid

                        else:  # calculate centroid deltas to compare to current frame position later

                            dx[i, j] = oldcxcy[0] - curcxcy[0]
                            dy[i, j] = oldcxcy[1] - curcxcy[1]

                for j in range(len(carids)):  # loops through all current car ids

                    sumsum = np.abs(dx[:, j]) + np.abs(dy[:, j])  # sums the deltas wrt to car ids

                    # finds which index carid had the min difference and this is true index
                    correctindextrue = np.argmin(np.abs(sumsum))
                    minx_index = correctindextrue
                    miny_index = correctindextrue

                    # acquires delta values of the minimum deltas in order to check if it is within radius later on
                    mindx = dx[minx_index, j]
                    mindy = dy[miny_index, j]

                    if mindx == 0 and mindy == 0 and np.all(dx[:, j] == 0) and np.all(dy[:, j] == 0):
                        # checks if minimum value is 0 and checks if all deltas are zero since this is empty set
                        # delta could be zero if centroid didn't move

                        continue  # continue to next carid

                    else:

                        # if delta values are less than maximum radius then add that centroid to that specific carid
                        if np.abs(mindx) < maxrad and np.abs(mindy) < maxrad:

                            # adds centroid to corresponding previously existing carid
                            df.at[int(framenumber), str(carids[j])] = [cxx[minx_index], cyy[miny_index]]
                            minx_index2.append(minx_index)  # appends all the indices that were added to previous carids
                            miny_index2.append(miny_index)

                for i in range(len(cxx)):  # loops through all centroids

                    # if centroid is not in the minindex list then another car needs to be added
                    if i not in minx_index2 and minx_index2:

                        df[str(totalcars)] = ""  # create another column with total cars
                        totalcars = totalcars + 1  # adds another total car the count
                        t = totalcars - 1  # t is a placeholder to total cars
                        carids.append(t)  # append to list of car ids
                        df.at[int(framenumber), str(t)] = [cxx[i], cyy[i]]  # add centroid to the new car id

                    elif curcxcy[0] and not oldcxcy and not minx_index2 and not miny_index2:
                        # checks if current centroid exists but previous centroid does not
                        # new car to be added in case minx_index2 is empty

                        df[str(totalcars)] = ""  # create another column with total cars
                        totalcars = totalcars + 1  # adds another total car the count
                        t = totalcars - 1  # t is a placeholder to total cars
                        carids.append(t)  # append to list of car ids
                        df.at[int(framenumber), str(t)] = [cxx[i], cyy[i]]  # add centroid to the new car id
CSV Example
Counting Objects
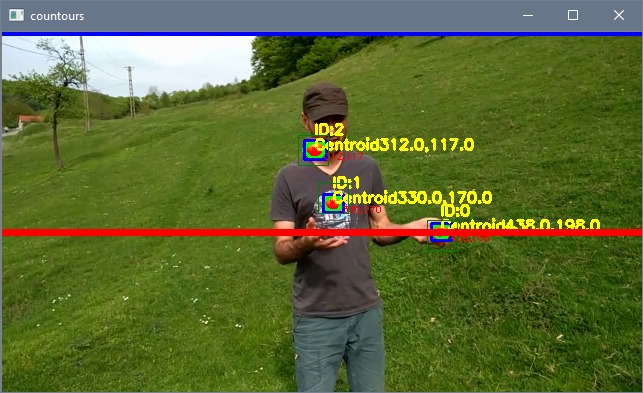
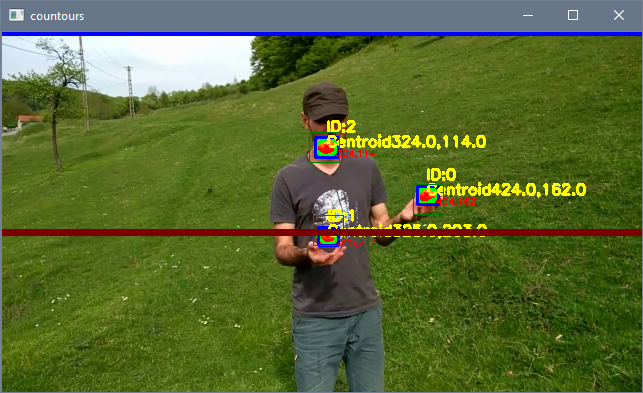
This section is identical to the Python OpenCV Traffic Counter: Counting Cars section except for the elimination of checking if an object has already been counted as crossing the counting line in lines 319 and 326. This section is responsible for counting the number of objects that have moved up or down based on the lineypos2 line (the green line) and adding text the object centroid. The logic of this section of the script (for counting if an object has crossed up) checks if the object's centroid in the previous frame is below or on the line and if the object's centroid in the current frame is on or above the line. The opposite is done if an object is crossing down. The script then creates red lines on top of the green line as a visual cue to signify that an object has crossed the line. More detailed information on how this tracking works can be seen in the link provided above.
The difference between this tutorial and the Traffic Counter tutorial is that the script does not check if the object has already crossed the lineypos2 line (in lines 319 and 326) since the objects will be moving across the line various times. Checking was necessary in the Traffic Counter tutorial as the car would only be crossing the line once and the centroid position between frames could cause an issue. This issue is now seen in this tutorial as the object centroid position could cause the object to be counted twice. This issue will be explained later on in the Known Issues section of this tutorial.
        # The section below labels the centroids on screen

        currentcars = 0  # current cars on screen
        currentcarsindex = []  # current cars on screen carid index

        for i in range(len(carids)):  # loops through all carids

            if df.at[int(framenumber), str(
                    carids[i])] != '':  # checks the current frame to see which car ids are active
                # by checking in centroid exists on current frame for certain car id

                currentcars = currentcars + 1  # adds another to current cars on screen
                currentcarsindex.append(i)  # adds car ids to current cars on screen

        for i in range(currentcars):  # loops through all current car ids on screen

            # grabs centroid of certain carid for current frame
            curcent = df.iloc[int(framenumber)][str(carids[currentcarsindex[i]])]

            # grabs centroid of certain carid for previous frame
            oldcent = df.iloc[int(framenumber - 1)][str(carids[currentcarsindex[i]])]

            if curcent:  # if there is a current centroid

                # On-screen text for current centroid
                cv2.putText(image, "Centroid" + str(curcent[0]) + "," + str(curcent[1]),
                            (int(curcent[0]), int(curcent[1])), cv2.FONT_HERSHEY_SIMPLEX, .5, (0, 255, 255), 2)

                cv2.putText(image, "ID:" + str(carids[currentcarsindex[i]]),
                            (int(curcent[0]), int(curcent[1] - 15)), cv2.FONT_HERSHEY_SIMPLEX, .5,
                            (0, 255, 255), 2)

                cv2.drawMarker(image, (int(curcent[0]), int(curcent[1])), (0, 0, 255), cv2.MARKER_STAR,
                               markerSize=5, thickness=1, line_type=cv2.LINE_AA)

                if oldcent:  # checks if old centroid exists
                    # adds radius box from previous centroid to current centroid for visualization
                    xstart = oldcent[0] - maxrad
                    ystart = oldcent[1] - maxrad
                    xwidth = oldcent[0] + maxrad
                    yheight = oldcent[1] + maxrad
                    cv2.rectangle(image, (int(xstart), int(ystart)), (int(xwidth), int(yheight)), (0, 125, 0),
                                  1)

                    # checks if old centroid is on or below line and curcent is on or above line
                    # to count cars and that car hasn't been counted yet
                    if oldcent[1] >= lineypos2 and curcent[1] <= lineypos2:

                        carscrossedup = carscrossedup + 1
                        cv2.line(image, (0, lineypos2), (width, lineypos2), (0, 0, 255), 5)

                    # checks if old centroid is on or above line and curcent is on or below line
                    # to count cars and that car hasn't been counted yet
                    elif oldcent[1] <= lineypos2 and curcent[1] >= lineypos2:

                        carscrosseddown = carscrosseddown + 1
                        cv2.line(image, (0, lineypos2), (width, lineypos2), (0, 0, 125), 5)
Up
Down
Finishing Touches
This section is identical to the Python OpenCV Traffic Counter: Finishing Touches section. This section is responsible for adding the text in the upper left hand corner of the image, showing the various images and transformations, saving the frame to the video file, and saving the dataframe to a CSV file. More detailed information on this section can be seen in the link provided above.
         # Top left hand corner on-screen text
        cv2.rectangle(image, (0, 0), (250, 100), (255, 0, 0), -1)  # background rectangle for on-screen text

        cv2.putText(image, "Balls in Area: " + str(currentcars), (0, 15), cv2.FONT_HERSHEY_SIMPLEX, .5,
                    (0, 170, 0), 1)

        cv2.putText(image, "Balls Crossed Up: " + str(carscrossedup), (0, 30), cv2.FONT_HERSHEY_SIMPLEX, .5,
                    (0, 170, 0), 1)

        cv2.putText(image, "Balls Crossed Down: " + str(carscrosseddown), (0, 45), cv2.FONT_HERSHEY_SIMPLEX, .5,
                    (0, 170, 0), 1)

        cv2.putText(image, "Total Balls Detected: " + str(len(carids)), (0, 60), cv2.FONT_HERSHEY_SIMPLEX, .5,
                    (0, 170, 0), 1)

        cv2.putText(image, "Frame: " + str(framenumber) + ' of ' + str(frames_count), (0, 75),
                    cv2.FONT_HERSHEY_SIMPLEX, .5, (0, 170, 0), 1)

        cv2.putText(image, 'Time: ' + str(round(framenumber / fps, 2)) + ' sec of ' + str(round(frames_count / fps, 2))
                    + ' sec', (0, 90), cv2.FONT_HERSHEY_SIMPLEX, .5, (0, 170, 0), 1)

        # displays images and transformations
        cv2.imshow("countours", image)
        cv2.moveWindow("countours", 0, 0)

        cv2.imshow("mask", mask)
        cv2.moveWindow("mask", int(width * ratio), 0)

        cv2.imshow("closing", closing)
        cv2.moveWindow("closing", width, 0)

        cv2.imshow("opening", opening)
        cv2.moveWindow("opening", 0, int(height * ratio))

        cv2.imshow("dilation", dilation)
        cv2.moveWindow("dilation", int(width * ratio), int(height * ratio))

        cv2.imshow("binary", bins)
        cv2.moveWindow("binary", width, int(height * ratio))

        video.write(image) # save the current image to video file from earlier

        # adds to framecount
        framenumber = framenumber + 1

        k = cv2.waitKey(int(1000 / fps)) & 0xff  # int(1000/fps) is normal speed since waitkey is in ms
        if k == 27:
            break

    else:  # if video is finished then break loop

        break

cap.release()
cv2.destroyAllWindows()

# saves dataframe to csv file for later analysis
df.to_csv('juggle.csv', sep=',')
Finishing Touches
Plotting the Data
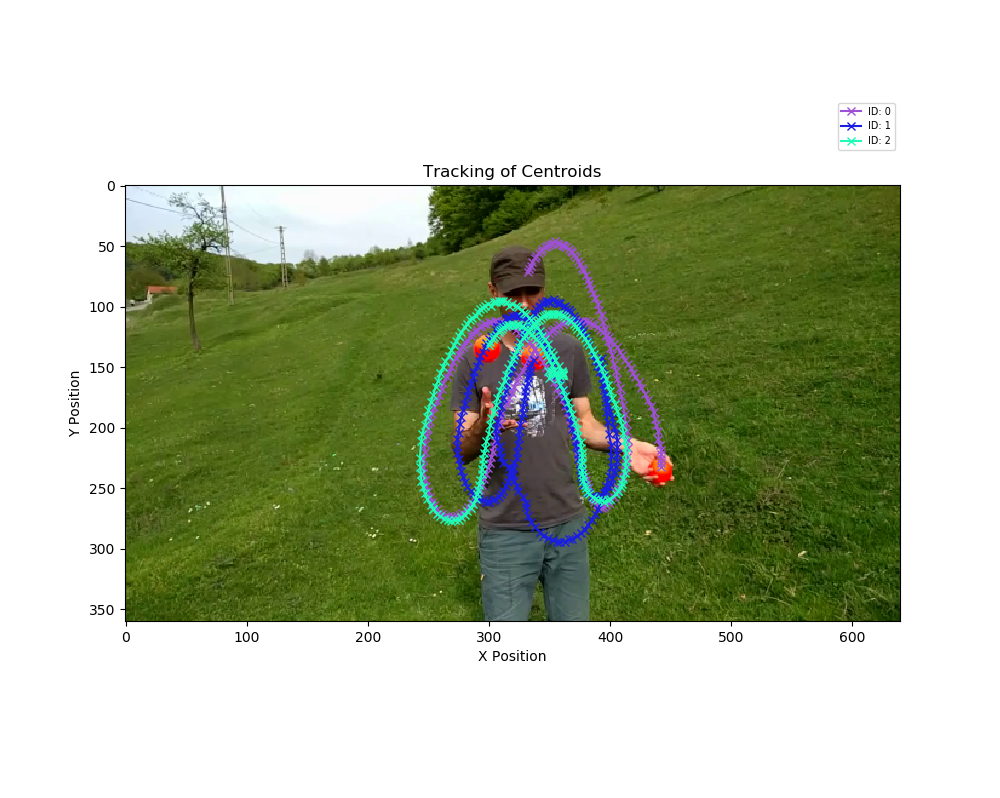
This section is identical to the Python OpenCV Traffic Counter: Plotting the Data section. This section is responsible for plotting the data acquired from dataframe CSV file saved in the script above. This script plots all the different objects captured with random colors on the first frame of the original video in order to view the objects' trajectory. More detailed information on this section can be seen in the link provided above.
import numpy as np
import matplotlib.pyplot as plt
import pandas as pd
import cv2
import random

cap = cv2.VideoCapture('juggle.mp4')
ret, frame = cap.read()
ratio = .5  # resize ratio
image = cv2.resize(frame, (0, 0), None, ratio, ratio)  # resize image

df = pd.read_csv('juggle.csv')  # reads csv file and makes it a dataframe
rows, columns = df.shape  # shape of dataframe
print('Rows:',rows)
print('Columns:',columns)

fig1 = plt.figure(figsize=(10, 8))  # width and height of image
plt.imshow(cv2.cvtColor(image, cv2.COLOR_BGR2RGB))  # plots first frame of video

for i in range(columns - 1):  # loops through all columns of dataframe, -1 since index is counted
    y = df.loc[df[str(i)].notnull(), str(i)].tolist()  # grabs not null data from column
    df2 = pd.DataFrame(y, columns=['xy'])  # create another dataframe with only one column

    # create another dataframe where it splits centroid x and y values into two columns
    df3 = pd.DataFrame(df2['xy'].str[1:-1].str.split(',', expand=True).astype(float))
    df3.columns = ['x', 'y']  # renames columns

    # plots series with random colors
    plt.plot(df3.x, df3.y, marker='x', color=[random.uniform(0, 1), random.uniform(0, 1), random.uniform(0, 1)],
             label='ID: ' + str(i))

# plot info
plt.title('Tracking of Centroids')
plt.xlabel('X Position')
plt.ylabel('Y Position')
plt.legend(bbox_to_anchor=(1, 1.2), fontsize='x-small')  # legend location and font
plt.show()
fig1.savefig('juggle.png')  # saves image
Plotting Data
Cautions
The cautions of this tutorial are the same as the cautions in the Python OpenCV Traffic Counter: Cautions section. Try to keep the objects distinguishable and unmerged with the transformations in lines 106-108 in order to avoid any discrepancies. The maximum radius must be small enough to avoid other centroids in case they disappear or merge but must also be large enough to keep track of the current centroid between frames. The centroid data will still be collected but there will be different object IDs that do not correspond to the correct objects.
Known Issues
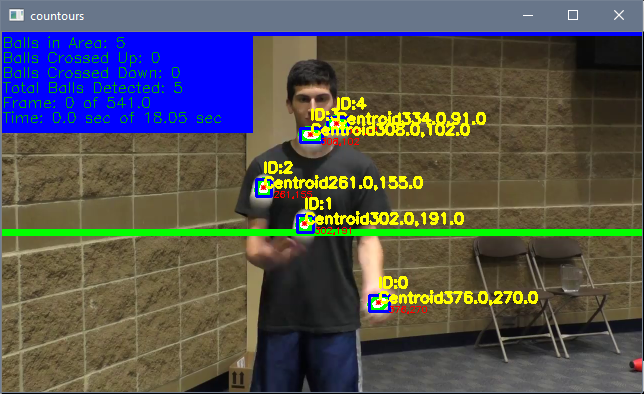
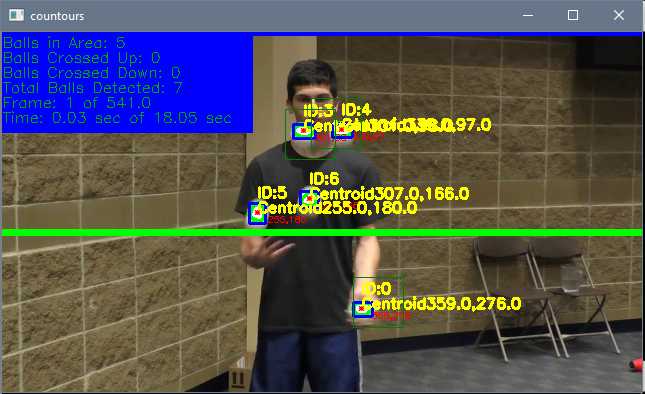
As mentioned earlier, there is a known issue if the objects move greater distances than the maximum radius allowable between frames. Below is a different juggling video in which the objects exhibit said behavior. The image Frame 0 below starts tracking all 5 objects on screen but the tracking has different effects with different values for the maximum radius allowable. Frame 1 with a maximum radius of 25 now detects more objects (noted by the lack of the thin green square signify that the object's centroid was not in the previous frame) and thinks that previous objects have disappeared since those objects' centroids have moved beyond the maximum radius allowable. Changing the maximum radius allowable to 50 fixes the issue as seen in the third image (where all objects now have a thin green squares) but can cause other problems such as conjoining of IDs as discussed in the Python OpenCV Traffic Counter: Known Issues section. This can also occur if the centroids moving large distances are actually closer to other centroids than their own in the previous frames since tracking is based off of proximity.
Frame 0
Frame 1 Max Radius 25
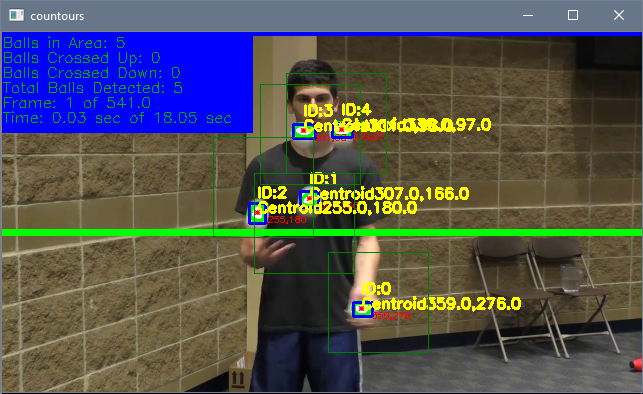
Frame 1 Max Radius 50
The other known issue is the double counting of centroids that have crossed a line since we have removed the double count check. In the images below, the bottom left ball is about to cross the lineypos2 line in frame 201. The ball then lands on the lineypos2 line in frame 202 causing the script to count it as crossing down since the centroid was above or on the line in the previous frame and the centroid is now on or below the line in the current frame. Here is where the issue arises in frame 203: since the centroid was above or on the line in the previous frame and the centroid is now on or below the line in the current frame, it also counts the ball as crossing. This issue throws off the count and can also be caused if the contour changes shape and causes the centroid to oscillate above and below the line between frames.
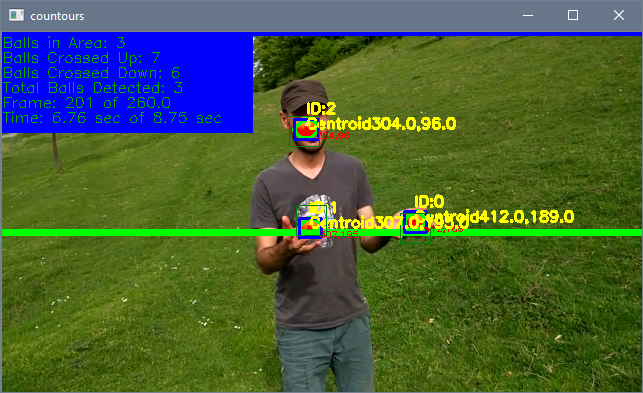
Double Counting Frame 201
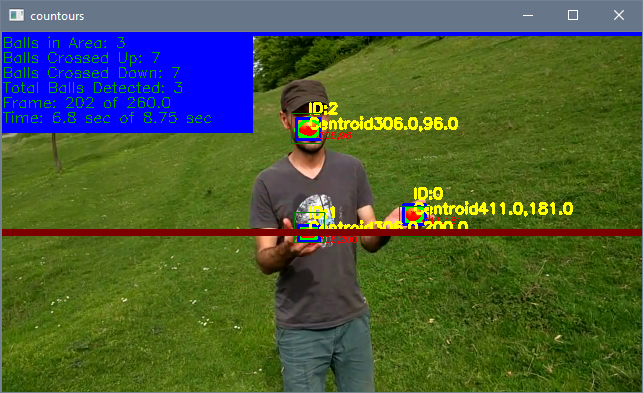
Double Counting Frame 202
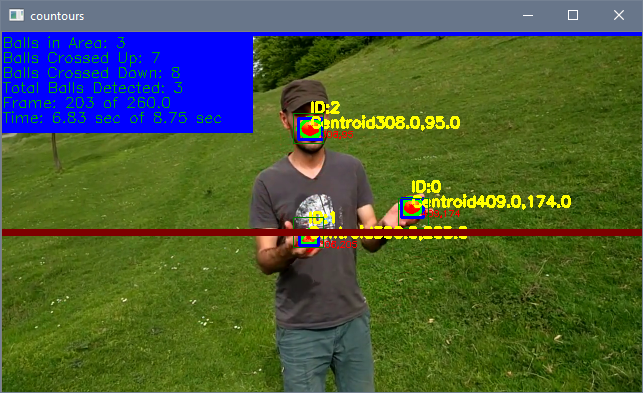
Double Counting Frame 203