Python OpenCV Traffic Counter
- Introduction
- Getting Started and Importing the Image
- Apply Thresholds and Transformations
- Create Contours and Acquire Centroids
- Keep Track of Centroids
- Counting Cars
- Finishing Touches
- Plotting the Data
- Cautions
- Known Issues
Introduction
This project will use Python and the OpenCV library to count cars on a highway. I will be using the Python IDE PyCharm to write and run the Python code and Prettify to display the code on this page. I will also be using the NumPy, Matplotlib, and Pandas libraries for this tutorial so please be sure to have those installed along with OpenCV. The Python code can be downloaded from my GitHub page. The source video file section I used for this tutorial is from Highway 01 - Free Video Footage - Background HD Free.
Getting Started and Importing the Image
The first step to counting cars is to import the necessary libraries. Lines 1-3 import NumPy (used for creating vectors and matrices), OpenCV (used for reading and manipulating the image), and Pandas (used for keeping the data in an organized manner). The next step is to open the video file named traffic.mp4 which is done in line 5 with cv2.VideoCapture(). Lines 6-10 acquire pertinent information about the video such as the total amount of frames (frames_count), the frames per second (fps), the width of the video (width), and height of the video (height). The width and height variables will later be used as integers int() to adjust the location of the images on the screen.
Lines 13 and 14 create a dataframe with the Pandas library where the number of rows equals the total amount frames in the video. This dataframe will be used to keep the car tracking data organized where new columns are added as new cars are detected in the video. Lines 16-21 are used to create counters or empty lists that will be used to keep track of certain data later on in the code. The background subtractor created in line 23 cv2.createBackgroundSubtractorMOG2() is one of the most important parts of this script as this helps isolate the moving objects from a static background. The background subtractor works well on videos that have a static background but a video with a background that is not stationary would most likely use different methods for isolating key objects. One such method is using HSV Color Filtering which can be seen in the Python OpenCV Juggle Counter tutorial.
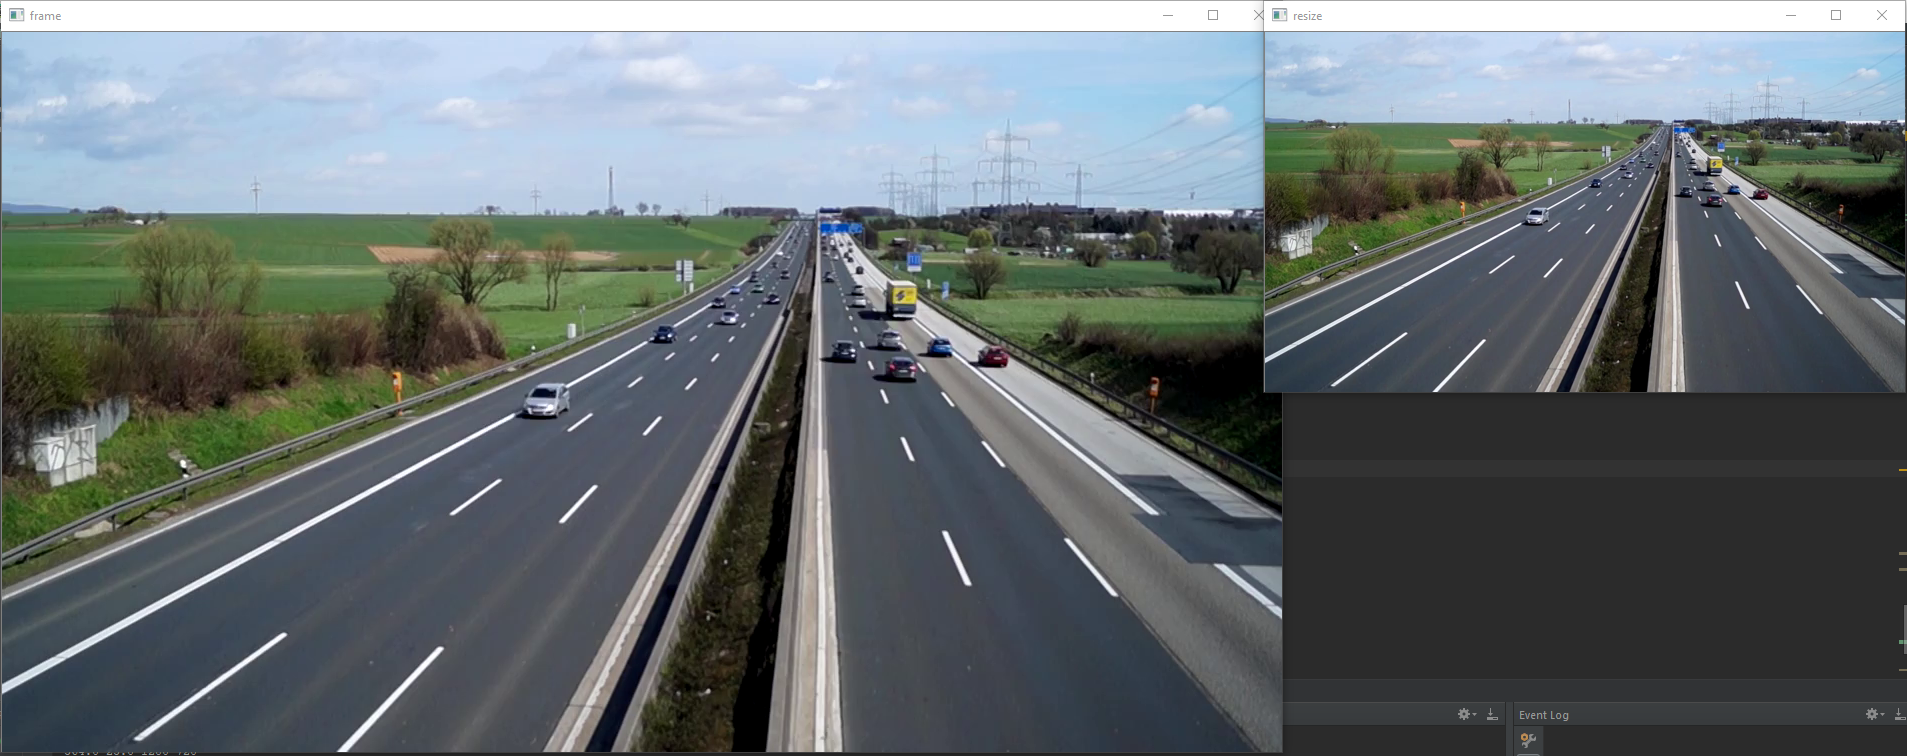
Lines 26-30 set up the necessary variables needed to start saving a video file with cv2.VideoWriter(). The ratio variable is used to resize the image in order to reduce lag. The while True: loop starting in line 32 keeps displaying each video frame after another if ret: is true (if a frame gets captured in line 34) otherwise it breaks out of the loop in lines 323-325 and stops the video. Line 38, along with the variable ratio, is used to resize each frame of the video to reduce lag. The video frames are displayed with cv2.imshow("WINDOWNAME", FRAMENAME) as seen in lines 296-312 later on in the code. The original and reduced size of the frame can be seen below. It is also useful to resize the image if it takes up too much space on the screen.
import numpy as np
import cv2
import pandas as pd

cap = cv2.VideoCapture('traffic.mp4')
frames_count, fps, width, height = cap.get(cv2.CAP_PROP_FRAME_COUNT), cap.get(cv2.CAP_PROP_FPS), cap.get(
    cv2.CAP_PROP_FRAME_WIDTH), cap.get(cv2.CAP_PROP_FRAME_HEIGHT)
width = int(width)
height = int(height)
print(frames_count, fps, width, height)

# creates a pandas data frame with the number of rows the same length as frame count
df = pd.DataFrame(index=range(int(frames_count)))
df.index.name = "Frames"

framenumber = 0  # keeps track of current frame
carscrossedup = 0  # keeps track of cars that crossed up
carscrosseddown = 0  # keeps track of cars that crossed down
carids = []  # blank list to add car ids
caridscrossed = []  # blank list to add car ids that have crossed
totalcars = 0  # keeps track of total cars

fgbg = cv2.createBackgroundSubtractorMOG2()  # create background subtractor

# information to start saving a video
ret, frame = cap.read()  # import image
ratio = .5  # resize ratio
image = cv2.resize(frame, (0, 0), None, ratio, ratio)  # resize image
width2, height2, channels = image.shape
video = cv2.VideoWriter('traffic_counter.avi', cv2.VideoWriter_fourcc('M', 'J', 'P', 'G'), fps, (height2, width2), 1)

while True:

    ret, frame = cap.read()  # import image

    if ret:  # if there is a frame continue with code

        image = cv2.resize(frame, (0, 0), None, ratio, ratio)  # resize image
Resize Image
Apply Thresholds and Transformations
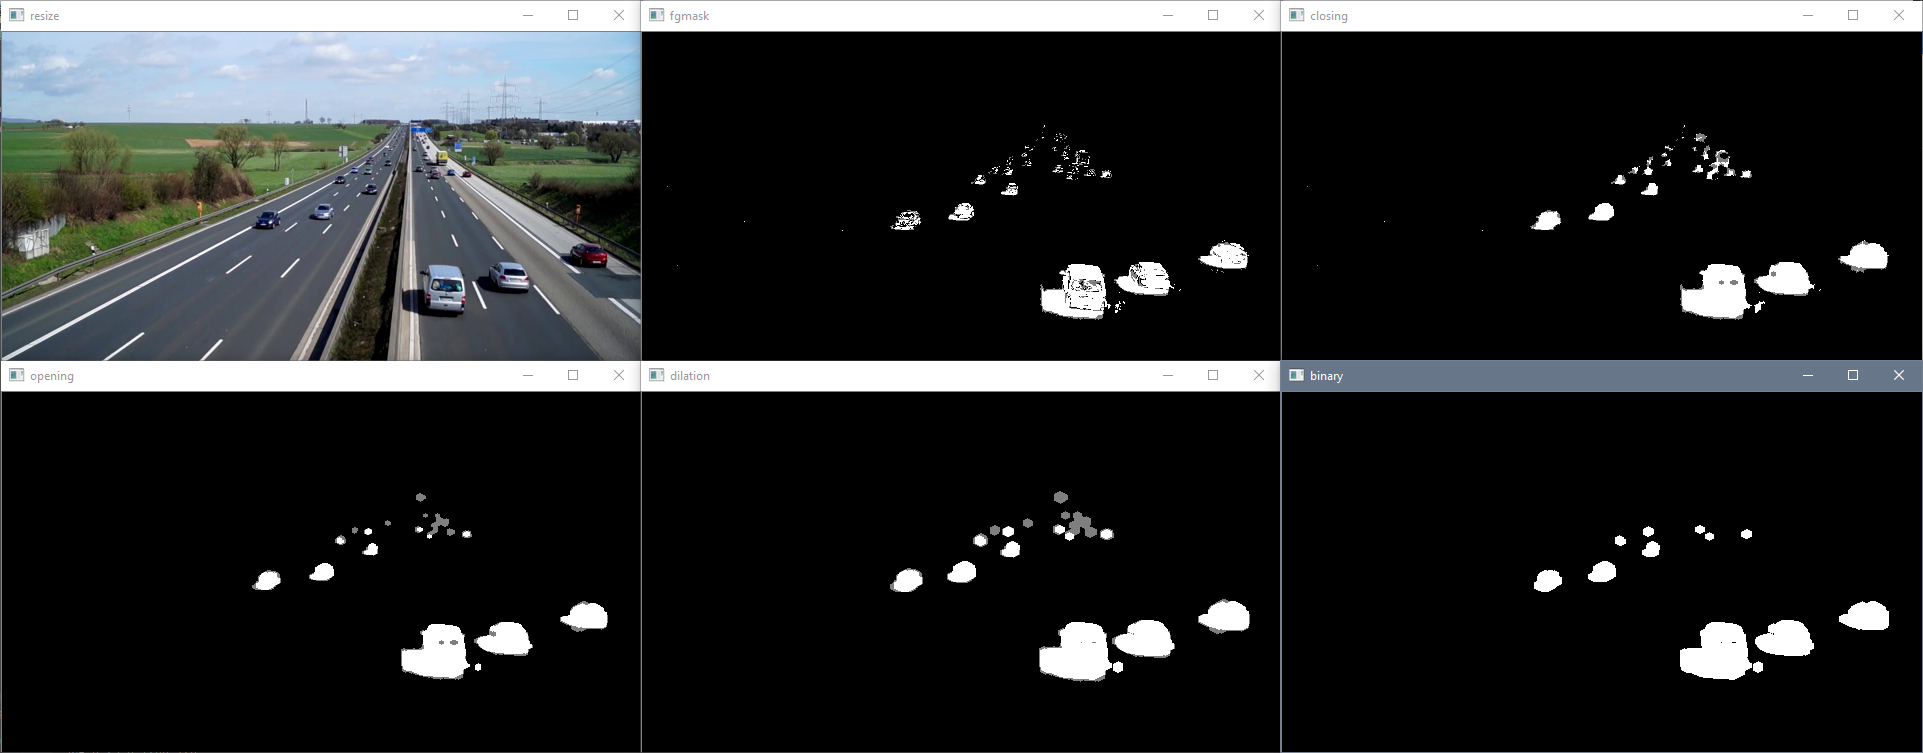
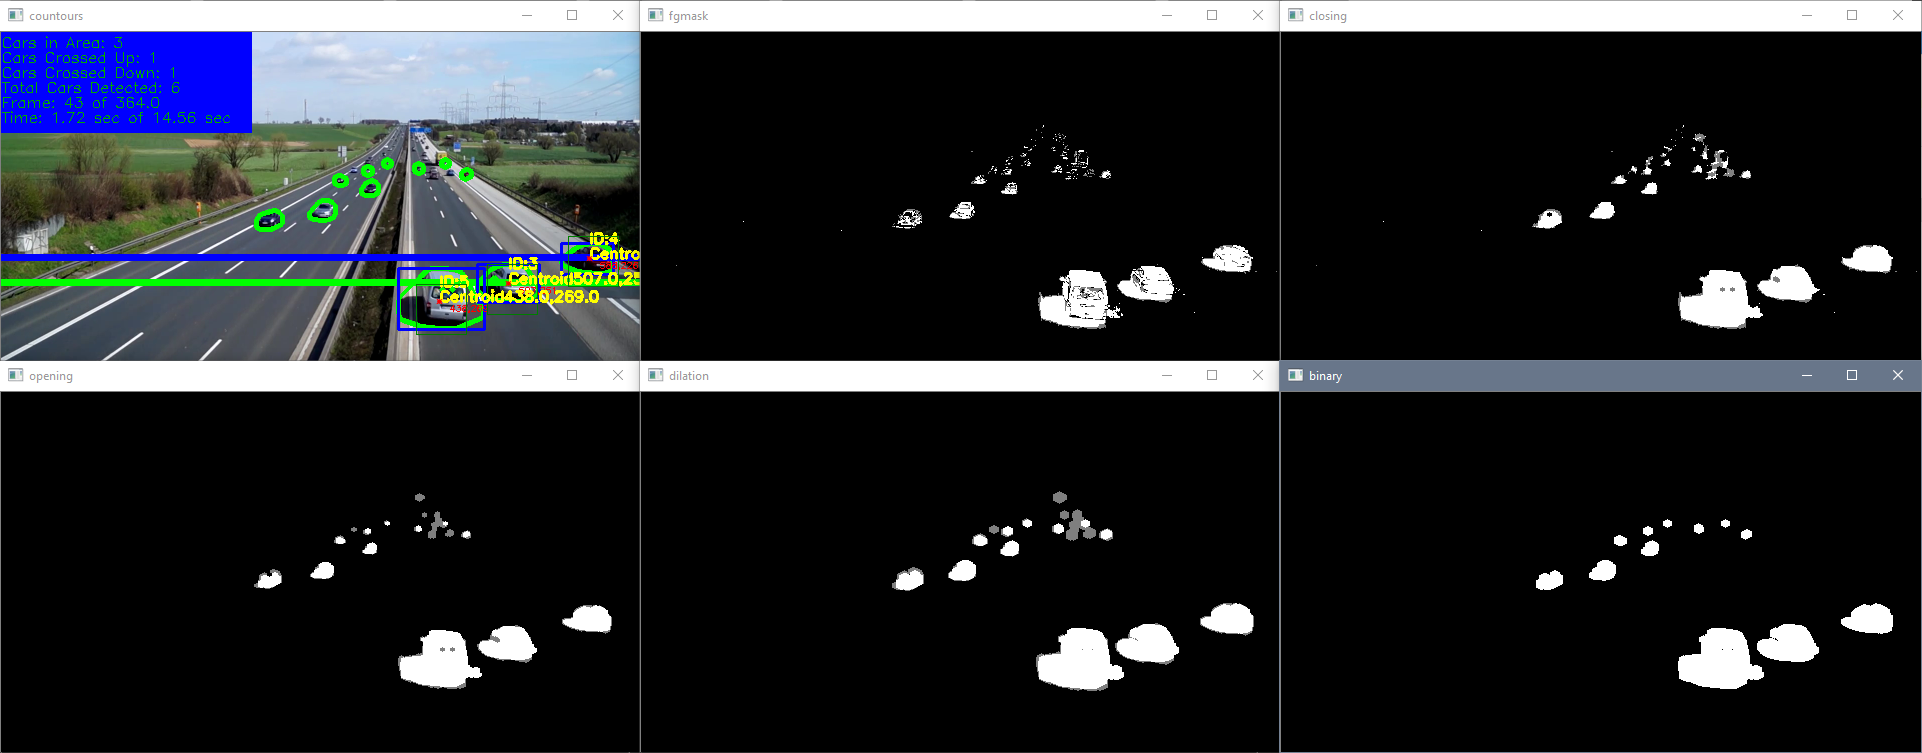
The next important step to counting cars is to apply thresholds and transformations to the image to allow better isolation of moving objects. Line 40 converts the image to grayscale for better analysis and line 42 applies the background subtractor to distinguish moving objects. The top left image below is the unaltered frame and the top middle image is the frame with background subtractor applied. As one can see, OpenCV was able to distinguish the moving cars from the static background. However, the background subtractor is not perfect and needs some transformations done to it to try and better isolate the moving cars.
The functions in lines 46-50 isolate the cars into shapes that can be more easily tracked. Line 46 states the type and size of the kernel which adjusts the image according to the morphological transformations in lines 47-49. Line 50 removes the 'shadows' from the transformations (the gray portions) to better isolate the cars. The main point of applying these transformations is to remove noise, isolate the cars, and make them into solid shapes that can be more easily tracked. The binary image bins in the bottom right corner will be used to create contours around the cars in the next section. Here are some links for more information on morphological transformations and the kernel.
        gray = cv2.cvtColor(image, cv2.COLOR_BGR2GRAY)  # converts image to gray

        fgmask = fgbg.apply(gray)  # uses the background subtraction

        # applies different thresholds to fgmask to try and isolate cars
        # just have to keep playing around with settings until cars are easily identifiable
        kernel = cv2.getStructuringElement(cv2.MORPH_ELLIPSE, (5, 5))  # kernel to apply to the morphology
        closing = cv2.morphologyEx(fgmask, cv2.MORPH_CLOSE, kernel)
        opening = cv2.morphologyEx(closing, cv2.MORPH_OPEN, kernel)
        dilation = cv2.dilate(opening, kernel)
        retvalbin, bins = cv2.threshold(dilation, 220, 255, cv2.THRESH_BINARY)  # removes the shadows
Transformations
Create Contours and Acquire Centroids
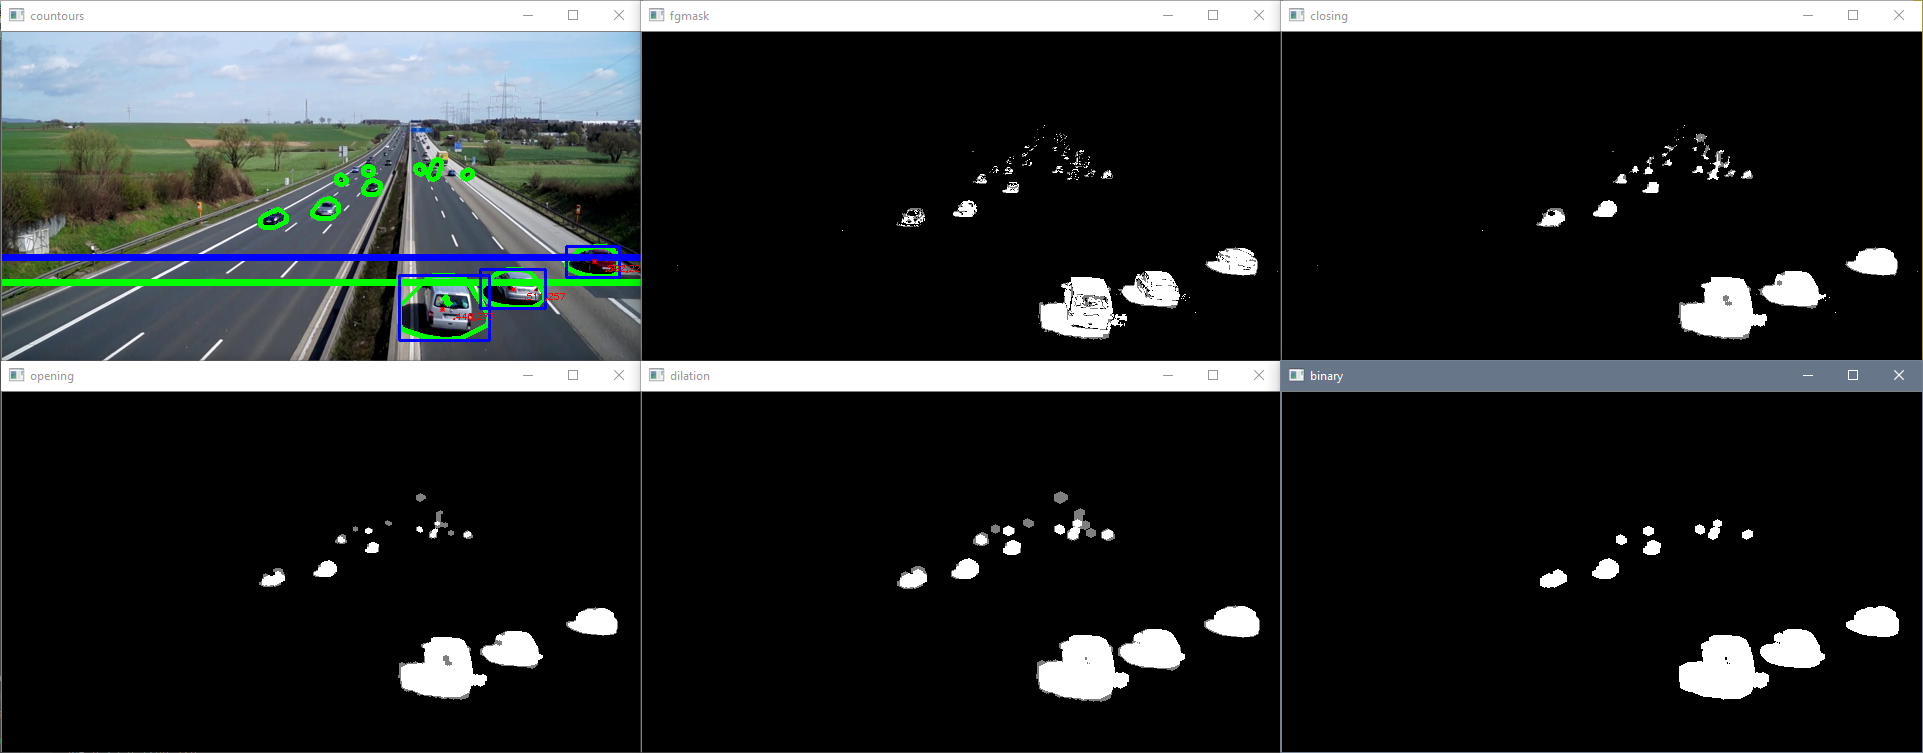
Now that the cars are better isolated, tracking them can be done a lot more easily. Line 53 draws contours around the isolated cars and line 56 creates an outline with the outermost points of the contours. Line 59 draws the convex hull contours on the image with the color green as seen in the top left image below. The horizontal lines in the image below are created in lines 62-67 of the script. The lineypos line (the blue line) is used later on in the code to indicate when to start and stop keeping track of the contours as we are only interested in contours that are well defined. As seen in the top left image below, the car contours in the distance start merging and becoming indistinguishable from other car contours which increases the difficulty in differentiating one car from another. Anything above the blue line ([x,y] zero position is top left corner of image) isn't kept track of but anything below is. The second line lineypos2 (the green line) is used later on in the code to keep track of whether the car is moving upwards or downwards by checking if the car passes the line when compared to the previous frame. This will be explained later on.
Lines 70 and 73 create variables for the minimum and maximum areas allowable for a contour to be counted. Lines 76 and 77 create a vector of zeroes with the length corresponding to the amount of contours currently on the screen (including the ones we are not interested in that are above the blue line). The loop in lines 79-111 loops through all the contours and filters out contours that do not meet certain criteria. The first criteria in line 81 is that the contour must be the parent contour, that is, it cannot be within another contour. This is important because sometimes small contours are within other contours due to the transformations applied earlier not eliminating every imperfection. This is eliminating any contour that is within any contour; a car cannot be within another car. Line 83 acquires the area of the contour and is checked in line 85 to see if it is within an acceptable size. This removes any contours that are too small such as noise or too large such as a big object that is not a car. Lines 88-91 acquire the x and y position of the contour's centroid to check if the car is below the lineypos line (the blue line) and keeps track of it as these contours are more distinguishable than the ones in the far off distance. If the centroid of the contour passes all of these criteria, then a blue box is created around the outer bounds of the contour (lines 97 and 100), the centroid text is labeled (line 103), a marker is created (line 106), and the x and y positions of the centroid are added to the vector created earlier (lines 110 and 111). Line 114 and 115 then extracts all the non-zero entries in the centroid vectors.
        # creates contours
        im2, contours, hierarchy = cv2.findContours(bins, cv2.RETR_TREE, cv2.CHAIN_APPROX_SIMPLE)

        # use convex hull to create polygon around contours
        hull = [cv2.convexHull(c) for c in contours]

        # draw contours
        cv2.drawContours(image, hull, -1, (0, 255, 0), 3)

        # line created to stop counting contours, needed as cars in distance become one big contour
        lineypos = 225
        cv2.line(image, (0, lineypos), (width, lineypos), (255, 0, 0), 5)

        # line y position created to count contours
        lineypos2 = 250
        cv2.line(image, (0, lineypos2), (width, lineypos2), (0, 255, 0), 5)

        # min area for contours in case a bunch of small noise contours are created
        minarea = 300

        # max area for contours, can be quite large for buses
        maxarea = 50000

        # vectors for the x and y locations of contour centroids in current frame
        cxx = np.zeros(len(contours))
        cyy = np.zeros(len(contours))

        for i in range(len(contours)):  # cycles through all contours in current frame

            if hierarchy[0, i, 3] == -1:  # using hierarchy to only count parent contours (contours not within others)

                area = cv2.contourArea(contours[i])  # area of contour

                if minarea < area < maxarea:  # area threshold for contour

                    # calculating centroids of contours
                    cnt = contours[i]
                    M = cv2.moments(cnt)
                    cx = int(M['m10'] / M['m00'])
                    cy = int(M['m01'] / M['m00'])

                    if cy > lineypos:  # filters out contours that are above line (y starts at top)

                        # gets bounding points of contour to create rectangle
                        # x,y is top left corner and w,h is width and height
                        x, y, w, h = cv2.boundingRect(cnt)

                        # creates a rectangle around contour
                        cv2.rectangle(image, (x, y), (x + w, y + h), (255, 0, 0), 2)

                        # Prints centroid text in order to double check later on
                        cv2.putText(image, str(cx) + "," + str(cy), (cx + 10, cy + 10), cv2.FONT_HERSHEY_SIMPLEX,
                                    .3, (0, 0, 255), 1)

                        cv2.drawMarker(image, (cx, cy), (0, 0, 255), cv2.MARKER_STAR, markerSize=5, thickness=1,
                                       line_type=cv2.LINE_AA)

                        # adds centroids that passed previous criteria to centroid list
                        cxx[i] = cx
                        cyy[i] = cy

        # eliminates zero entries (centroids that were not added)
        cxx = cxx[cxx != 0]
        cyy = cyy[cyy != 0]
Contours and Centroids
Keep Track of Centroids
The section of the script below is responsible for keeping track of the cars in the video. The method I used for keeping track of the cars is to check which x and y centroid position pair in the current frame is closest to another x and y centroid position pair in the previous frame. This works great for this application since the contours are large and spaced out but can cause an issue when the contours are small and in close proximity with a low frame rate. I will explain this issue later on in this tutorial.
Line 118 and 119 create an empty list that will be used later on for the indices of the centroids in the current frame that are added to centroids in the previous frame. Line 122 sets a maximum radius that the centroid is allowed to move to be considered the same centroid in the previous frame. The if statement in lines 126-219 is the algorithm that keeps track of the cars. As mentioned before, I am checking which centroids in the current frame are closest to centroids in the previous frame in order to keep track of which car is which. The first if statement if len(cxx): in line 126 checks if there are any centroids in the current frame that have passed the criteria mentioned in the section above. If there are centroids that have passed the criteria, then the rest of the if statement can commence in order to start tracking cars.
The next if statement if not carids: in line 128 checks if the empty list carids created in line 19 is indeed empty. This is used to check if there have not been any cars recorded yet. If there have not been any cars recorded yet, then lines 130-138 loop through all the current centroids that have passed the criteria and creates carids to start keeping track of cars. The new carids are appended to the empty carid list (created in line 19) in line 132 and a new carid column is added to the dataframe (created in line 13) in line 133. The carids' corresponding x and y centroid position are added to the dataframe for that specific frame row (framenumber) and carid column (carids) in line 136. Finally, the totalcars counter increases the total car count in line 138.
If there are previous carids listed, then the else statement in line 140 is activated. The dx and dy matrices in line 142 and 143 are created to track the deltas between the x and y positions of all the centroids in the current frame and previous frame. The loops in line 145 and 147 then loop through all the centroids on the current frame and previously recorded carids to populate the dx and dy matrices. Line 150 and 153 gather the centroid positions of the old and current frames, respectively. Line 155 is important when previous cars leave the screen for multiple frames and a new car appears. Thus, if we look at the previous centroid of a carid that has left the screen, oldcxcy would be empty. If oldcxcy is empty, then the inner loop moves on to the next carid. Line 159-162 calculates the old and current centroid deltas.
The loop in lines 164-191 calculates the minimum delta pairs and adds that centroid to its corresponding carid. Line 166 sums dx and dy for each centroid on screen with respect to a carid. The index of the first minimum is then acquired in line 169 and is assigned as the minimum index for the x and y centroid position. Gathering the first minimum value in line 169 is fine because sumsum = [ 0 0 X] would mean that two centroids are on top of one another. However, this is part of where the known issue mentioned above comes into play which will be discussed later on.
Line 174 and 175 then acquire the actual minimum delta value of the x and y positions to check for a certain criteria. The if statement in line 177 checks if the values of mindx and mindy are zero and that all the dx and dy values for that carid are zero as well in order to continue to the next j. The mindx and mindy values can be zero if the centroid did not move at all (as contours can change shapes and have the centroid in same position) or if it is an empty set as indicated by dx[:,j] == 0 and dy[:,j] == 0. If the centroid did not move, it can be added to a carid in the else statement in line 183. However, if it is an empty set, then it will not be added to any carid. The else statement in line 183 and if statement in line 186 then add the current frame centroid to a certain carid column in line 189 if the delta values are below the maximum radius allowable. The size of this maximum radius is also part of the known issue mentioned above. Lines 190 and 191 append the indices to a list to check which centroids have been added to previous carids.
The for loop in line 193 cycles through the length of the current centroids available in order to add a new car to the dataframe. The first if statement that the centroid needs to pass in order to be added as a new car to the dataframe is to check if it is not in the lists of centroids added from before (minx_index2 and miny_index2) meaning that this centroid does not match a previous carid. The else if statement is then used to check if the current centroid exists, if the old centroid does not exist, and if the lists of centroids added to carids (minx_index2 and miny_index2) are empty in order to add a new car to the dataframe. This statement captures new cars when previous cars have vacated the screen for multiple frames.
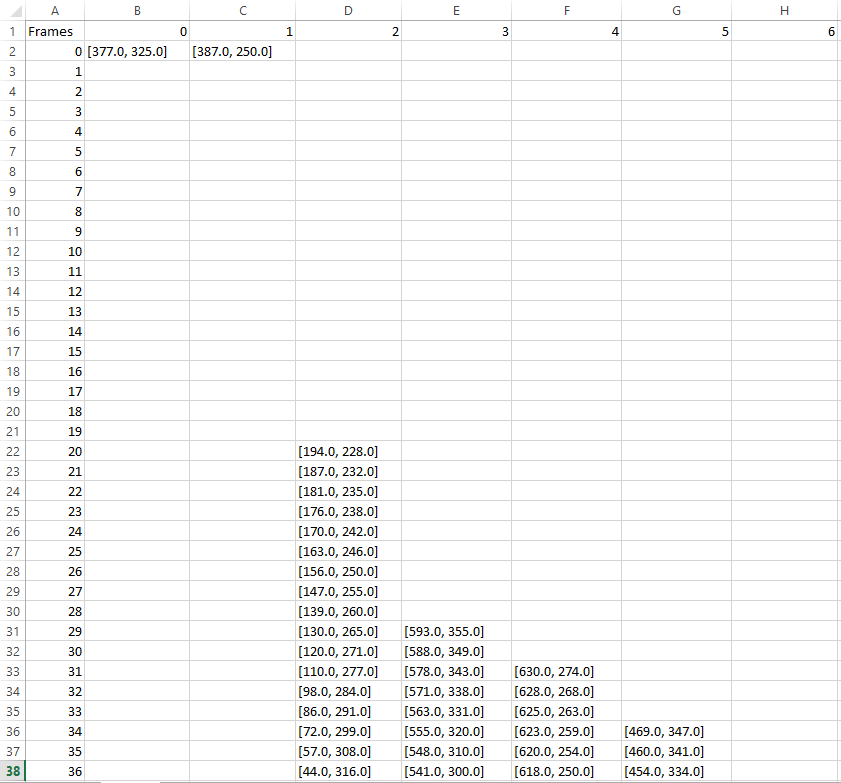
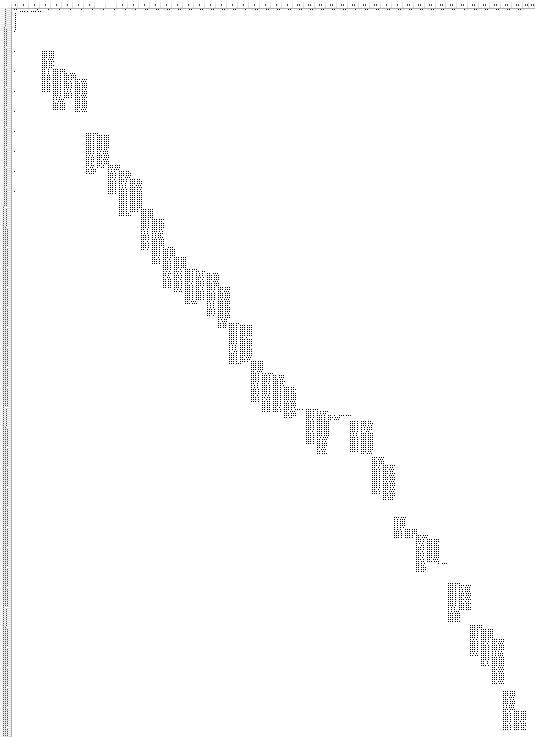
Examples of what the dataframe looks like when it is saved as a CSV file in line 331 can be seen below. The left most column is the index which corresponds to the total amount frames in the video and each column is a different carid. The data populated are the x and y centroid positions of each car on each frame.
        # empty list to later check which centroid indices were added to dataframe
        minx_index2 = []
        miny_index2 = []

        # maximum allowable radius for current frame centroid to be considered the same centroid from previous frame
        maxrad = 25

        # The section below keeps track of the centroids and assigns them to old carids or new carids

        if len(cxx):  # if there are centroids in the specified area

            if not carids:  # if carids is empty

                for i in range(len(cxx)):  # loops through all centroids

                    carids.append(i)  # adds a car id to the empty list carids
                    df[str(carids[i])] = ""  # adds a column to the dataframe corresponding to a carid

                    # assigns the centroid values to the current frame (row) and carid (column)
                    df.at[int(framenumber), str(carids[i])] = [cxx[i], cyy[i]]

                    totalcars = carids[i] + 1  # adds one count to total cars

            else:  # if there are already car ids

                dx = np.zeros((len(cxx), len(carids)))  # new arrays to calculate deltas
                dy = np.zeros((len(cyy), len(carids)))  # new arrays to calculate deltas

                for i in range(len(cxx)):  # loops through all centroids

                    for j in range(len(carids)):  # loops through all recorded car ids

                        # acquires centroid from previous frame for specific carid
                        oldcxcy = df.iloc[int(framenumber - 1)][str(carids[j])]

                        # acquires current frame centroid that doesn't necessarily line up with previous frame centroid
                        curcxcy = np.array([cxx[i], cyy[i]])

                        if not oldcxcy:  # checks if old centroid is empty in case car leaves screen and new car shows

                            continue  # continue to next carid

                        else:  # calculate centroid deltas to compare to current frame position later

                            dx[i, j] = oldcxcy[0] - curcxcy[0]
                            dy[i, j] = oldcxcy[1] - curcxcy[1]

                for j in range(len(carids)):  # loops through all current car ids

                    sumsum = np.abs(dx[:, j]) + np.abs(dy[:, j])  # sums the deltas wrt to car ids

                    # finds which index carid had the min difference and this is true index
                    correctindextrue = np.argmin(np.abs(sumsum))
                    minx_index = correctindextrue
                    miny_index = correctindextrue

                    # acquires delta values of the minimum deltas in order to check if it is within radius later on
                    mindx = dx[minx_index, j]
                    mindy = dy[miny_index, j]

                    if mindx == 0 and mindy == 0 and np.all(dx[:, j] == 0) and np.all(dy[:, j] == 0):
                        # checks if minimum value is 0 and checks if all deltas are zero since this is empty set
                        # delta could be zero if centroid didn't move

                        continue  # continue to next carid

                    else:

                        # if delta values are less than maximum radius then add that centroid to that specific carid
                        if np.abs(mindx) < maxrad and np.abs(mindy) < maxrad:

                            # adds centroid to corresponding previously existing carid
                            df.at[int(framenumber), str(carids[j])] = [cxx[minx_index], cyy[miny_index]]
                            minx_index2.append(minx_index)  # appends all the indices that were added to previous carids
                            miny_index2.append(miny_index)

                for i in range(len(cxx)):  # loops through all centroids

                    # if centroid is not in the minindex list then another car needs to be added
                    if i not in minx_index2 and miny_index2:

                        df[str(totalcars)] = ""  # create another column with total cars
                        totalcars = totalcars + 1  # adds another total car the count
                        t = totalcars - 1  # t is a placeholder to total cars
                        carids.append(t)  # append to list of car ids
                        df.at[int(framenumber), str(t)] = [cxx[i], cyy[i]]  # add centroid to the new car id

                    elif curcxcy[0] and not oldcxcy and not minx_index2 and not miny_index2:
                        # checks if current centroid exists but previous centroid does not
                        # new car to be added in case minx_index2 is empty

                        df[str(totalcars)] = ""  # create another column with total cars
                        totalcars = totalcars + 1  # adds another total car the count
                        t = totalcars - 1  # t is a placeholder to total cars
                        carids.append(t)  # append to list of car ids
                        df.at[int(framenumber), str(t)] = [cxx[i], cyy[i]]  # add centroid to the new car id
CSV Example
CSV Example All
Counting Cars
The loops below are responsible for counting cars and adding that information to the image. Line 216 creates a counter to count the number of current cars that are below lineypos and have passed the criteria for the current frame. Line 217 is an empty list which keeps track of the current carids that are on the screen. The loop in line 219 loops through all the carids available and line 221 only captures carids that have centroid data for the current frame. Line 225 adds to the number of current cars on screen. Line 226 appends to the list of current carids on screen.
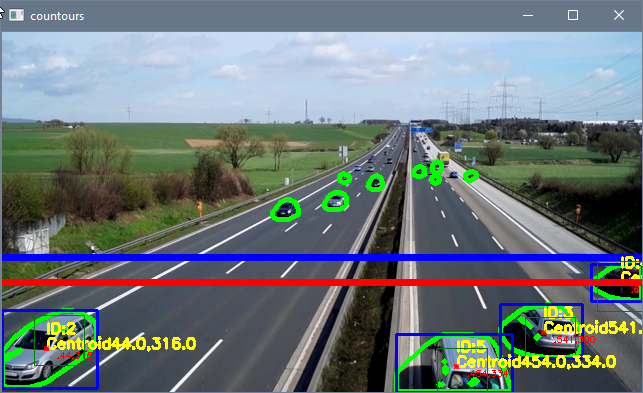
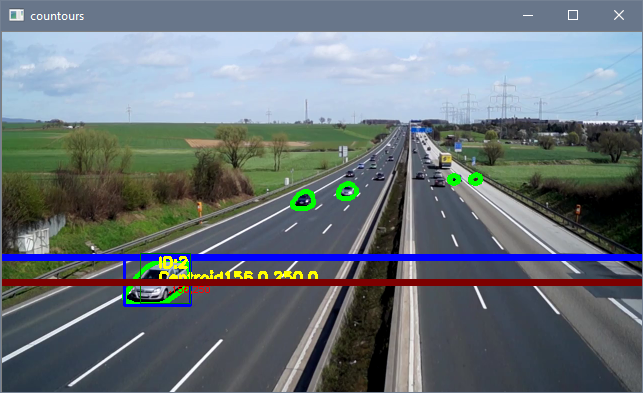
The loop in line 228 loops through all the current cars in the current frame and acquires their current and old centroids in line 231 and 234, respectively. If the current centroid exists, on screen text such as centroid location, carid, and a marker is added next to the car in lines 239-246. The code then checks if the old centroid exists in line 248 signifying that this carid has been on screen for the previous frame as well. A thin green box is created around the old centroid in lines 250-254 to display the maximum radius criteria as seen in the image below. The if and elif statements in lines 258 and 268 determine if a car has crossed up or down based on lineypos2, respectively.
Line 258 checks if the old centroid y position is greater than or equal to lineypos2 (car is below green line), if current centroid y position is less than or equal to lineypos2 (car is above green line), and if the car is not in the current list of cars that have crossed already. This is important in order to not double count the object crossing as it can be double counted as seen in the Python CV Juggle Counter: Known Issues section where the issue is explained. If the car passes these criteria, then the code adds one to the car crossed up counter and creates a red line on top of lineypos2 for that instant. Line 268 does the same except for cars crossed down and creates a darker red line.
        # The section below labels the centroids on screen

        currentcars = 0  # current cars on screen
        currentcarsindex = []  # current cars on screen carid index

        for i in range(len(carids)):  # loops through all carids

            if df.at[int(framenumber), str(carids[i])] != '':
                # checks the current frame to see which car ids are active
                # by checking in centroid exists on current frame for certain car id

                currentcars = currentcars + 1  # adds another to current cars on screen
                currentcarsindex.append(i)  # adds car ids to current cars on screen

        for i in range(currentcars):  # loops through all current car ids on screen

            # grabs centroid of certain carid for current frame
            curcent = df.iloc[int(framenumber)][str(carids[currentcarsindex[i]])]

            # grabs centroid of certain carid for previous frame
            oldcent = df.iloc[int(framenumber - 1)][str(carids[currentcarsindex[i]])]

            if curcent:  # if there is a current centroid

                # On-screen text for current centroid
                cv2.putText(image, "Centroid" + str(curcent[0]) + "," + str(curcent[1]),
                            (int(curcent[0]), int(curcent[1])), cv2.FONT_HERSHEY_SIMPLEX, .5, (0, 255, 255), 2)

                cv2.putText(image, "ID:" + str(carids[currentcarsindex[i]]), (int(curcent[0]), int(curcent[1] - 15)),
                            cv2.FONT_HERSHEY_SIMPLEX, .5, (0, 255, 255), 2)

                cv2.drawMarker(image, (int(curcent[0]), int(curcent[1])), (0, 0, 255), cv2.MARKER_STAR, markerSize=5,
                               thickness=1, line_type=cv2.LINE_AA)

                if oldcent:  # checks if old centroid exists
                    # adds radius box from previous centroid to current centroid for visualization
                    xstart = oldcent[0] - maxrad
                    ystart = oldcent[1] - maxrad
                    xwidth = oldcent[0] + maxrad
                    yheight = oldcent[1] + maxrad
                    cv2.rectangle(image, (int(xstart), int(ystart)), (int(xwidth), int(yheight)), (0, 125, 0), 1)

                    # checks if old centroid is on or below line and curcent is on or above line
                    # to count cars and that car hasn't been counted yet
                    if oldcent[1] >= lineypos2 and curcent[1] <= lineypos2 and carids[
                        currentcarsindex[i]] not in caridscrossed:

                        carscrossedup = carscrossedup + 1
                        cv2.line(image, (0, lineypos2), (width, lineypos2), (0, 0, 255), 5)
                        caridscrossed.append(
                            currentcarsindex[i])  # adds car id to list of count cars to prevent double counting

                    # checks if old centroid is on or above line and curcent is on or below line
                    # to count cars and that car hasn't been counted yet
                    elif oldcent[1] <= lineypos2 and curcent[1] >= lineypos2 and carids[
                        currentcarsindex[i]] not in caridscrossed:

                        carscrosseddown = carscrosseddown + 1
                        cv2.line(image, (0, lineypos2), (width, lineypos2), (0, 0, 125), 5)
                        caridscrossed.append(currentcarsindex[i])
Up
Down
Finishing Touches
Lines 276-293 add text to the top left corner of the image as seen below. Lines 296-312 display the image and the different types of transformations on the screen. Line 314 writes the frame image to the video file created earlier in line 30. Line 317 adds a counter to the framenumber. The statement in lines 319-321 adjusts the frame rate of the video being displayed with the cv2.waitKey() command and allows the user to press 'ESC' to quit the script. A smaller value in cv2.waitKey() causes the frames to be displayed at a slower rate and a value of 0 waits for the user to press any key before displaying the next frame. Lines 323-325 is the end of the if statement that started in line 36 and is activated when there are no more frames left to display and ends the video. Line 327 releases the video that was being used and line 328 closes all current windows. Line 331 saves the dataframe to a CSV file which contains all the carids and centroid values for each frame to be used later on for plotting the movement of the cars.
        # Top left hand corner on-screen text
        cv2.rectangle(image, (0, 0), (250, 100), (255, 0, 0), -1)  # background rectangle for on-screen text

        cv2.putText(image, "Cars in Area: " + str(currentcars), (0, 15), cv2.FONT_HERSHEY_SIMPLEX, .5, (0, 170, 0), 1)

        cv2.putText(image, "Cars Crossed Up: " + str(carscrossedup), (0, 30), cv2.FONT_HERSHEY_SIMPLEX, .5, (0, 170, 0),
                    1)

        cv2.putText(image, "Cars Crossed Down: " + str(carscrosseddown), (0, 45), cv2.FONT_HERSHEY_SIMPLEX, .5,
                    (0, 170, 0), 1)

        cv2.putText(image, "Total Cars Detected: " + str(len(carids)), (0, 60), cv2.FONT_HERSHEY_SIMPLEX, .5,
                    (0, 170, 0), 1)

        cv2.putText(image, "Frame: " + str(framenumber) + ' of ' + str(frames_count), (0, 75), cv2.FONT_HERSHEY_SIMPLEX,
                    .5, (0, 170, 0), 1)

        cv2.putText(image, 'Time: ' + str(round(framenumber / fps, 2)) + ' sec of ' + str(round(frames_count / fps, 2))
                    + ' sec', (0, 90), cv2.FONT_HERSHEY_SIMPLEX, .5, (0, 170, 0), 1)

        # displays images and transformations
        cv2.imshow("countours", image)
        cv2.moveWindow("countours", 0, 0)

        cv2.imshow("fgmask", fgmask)
        cv2.moveWindow("fgmask", int(width * ratio), 0)

        cv2.imshow("closing", closing)
        cv2.moveWindow("closing", width, 0)

        cv2.imshow("opening", opening)
        cv2.moveWindow("opening", 0, int(height * ratio))

        cv2.imshow("dilation", dilation)
        cv2.moveWindow("dilation", int(width * ratio), int(height * ratio))

        cv2.imshow("binary", bins)
        cv2.moveWindow("binary", width, int(height * ratio))

        video.write(image) # save the current image to video file from earlier

        # adds to framecount
        framenumber = framenumber + 1

        k = cv2.waitKey(int(1000 / fps)) & 0xff  # int(1000/fps) is normal speed since waitkey is in ms
        if k == 27:
            break

    else:  # if video is finished then break loop

        break

cap.release()
cv2.destroyAllWindows()

# saves dataframe to csv file for later analysis
df.to_csv('traffic.csv', sep=',')
Finishing Touches
Plotting the Data
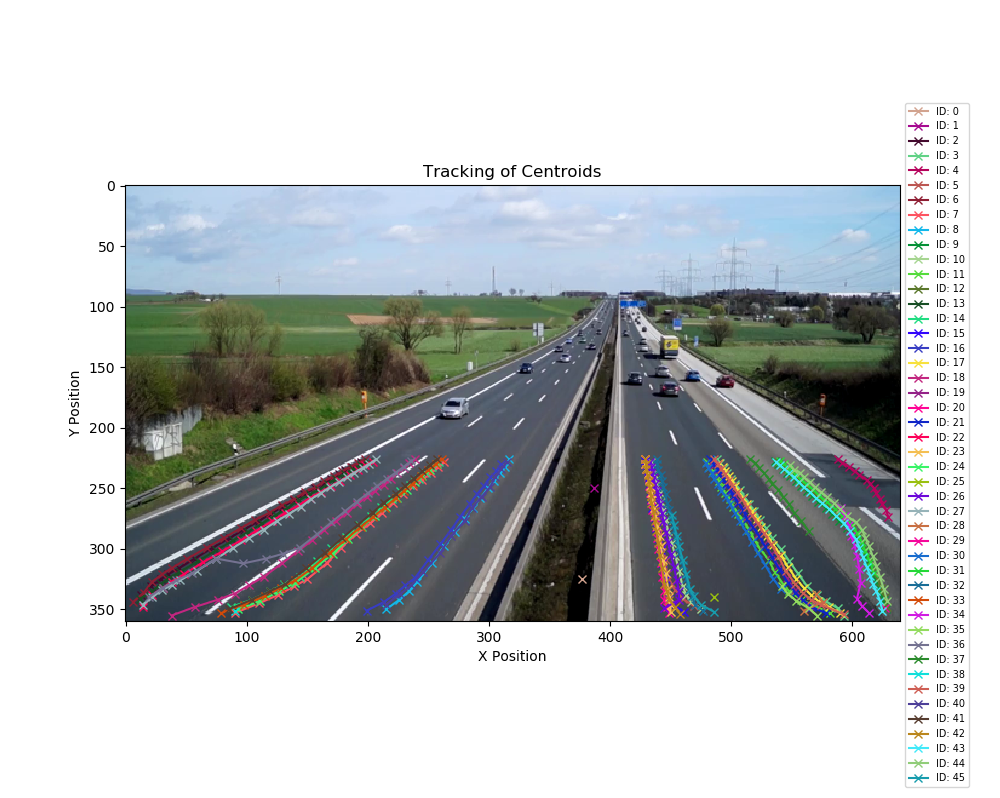
The script below plots the data from the dataframe CSV file previously acquired in the script above. Lines 1-5 import the necessary libraries where Matplotlib is a plotting library and random imports a module for randomizing numbers. Lines 7-10 capture the first frame of the video in order to overlay the data on the image that it was taken from. Make sure the ratio is the same as in the previous script or else the image will not match the data. The dataframe is read in line 12 and information about the data frame is seen in lines 13-15. Lines 17 and 18 create the figure, adjusts its size, and displays the first frame of the video.
The for loop in line 20 cycles through all the columns in the dataframe (minus one since the index of the dataframe counts as a column) in order to start plotting data. Line 21 acquires values that are not empty for that specific carid and line 22 creates another dataframe with those values. Lines 25-26 create another dataframe that splits up the x and y positions of the centroids into two columns since they were previously combined into one column. Line 29 plots the data for a specific carid with random colors. Lines 33-36 have plot information, line 37 shows the plot, and line 38 saves the plot. The data overlaid on the first frame of the video can be seen below.
import numpy as np
import matplotlib.pyplot as plt
import pandas as pd
import cv2
import random

cap = cv2.VideoCapture('traffic.mp4')
ret, frame = cap.read()
ratio = .5  # resize ratio
image = cv2.resize(frame, (0, 0), None, ratio, ratio)  # resize image

df = pd.read_csv('traffic.csv')  # reads csv file and makes it a dataframe
rows, columns = df.shape  # shape of dataframe
print('Rows:',rows)
print('Columns:',columns)

fig1 = plt.figure(figsize=(10, 8))  # width and height of image
plt.imshow(cv2.cvtColor(image, cv2.COLOR_BGR2RGB))  # plots first frame of video

for i in range(columns - 1):  # loops through all columns of dataframe, -1 since index is counted
    y = df.loc[df[str(i)].notnull(), str(i)].tolist()  # grabs not null data from column
    df2 = pd.DataFrame(y, columns=['xy'])  # create another dataframe with only one column

    # create another dataframe where it splits centroid x and y values into two columns
    df3 = pd.DataFrame(df2['xy'].str[1:-1].str.split(',', expand=True).astype(float))
    df3.columns = ['x', 'y']  # renames columns

    # plots series with random colors
    plt.plot(df3.x, df3.y, marker='x', color=[random.uniform(0, 1), random.uniform(0, 1), random.uniform(0, 1)],
             label='ID: ' + str(i))

# plot info
plt.title('Tracking of Centroids')
plt.xlabel('X Position')
plt.ylabel('Y Position')
plt.legend(bbox_to_anchor=(1, 1.2), fontsize='x-small')  # legend location and font
plt.show()
fig1.savefig('traffic.png')  # saves image
Plotting Data
Cautions
As can be seen in the plot above, the tracking works great but can sometimes track extra contours due to the imperfections of the applied transformations. The two carids that are between the two highways are caused by the first couple of frames where the background subtractor is adjusting and it catches some differences. This does not affect the tracking but just gives two extra carids.

Frame 0
The merging and unmerging of contours can also cause the algorithm to track new carids. As seen below, two contours merging into one in the bottom right hand corner causes one contour to be removed and the other to keep track of the merged contour if the previous centroid is within the maximum radius. If the contour splits again into two cars, the algorithm will create another carid if the previous centroid is outside the maximum radius. Again, not really a tracking issue but just causes multiple carids to be created due to the contours changing. However, this will prevent the car crossing count to be off since those carids that disappeared never crossed lineypos2.

Frame 202 Max Radius 25

Frame 203 Max Radius 25

Frame 205 Max Radius 25
Another instance when multiple carids are created is when the image brightens up (I believe) and causes a lot of contours to be created. This can be seen below. This just creates multiple carids but does not affect tracking. The main takeaway is to make sure the cars are easily distinguishable, do not merge, and that there are no random image brightenings. If this is done, the tracking will work just fine.

Bright
Known Issues
A known issue with the tracking algorithm arises if the maximum radius is too large and multiple centroids are close to other centroids. Below is frame 199 and 200 with a maximum radius of 25 and 50. Frame 199 has a two contours (ID: 25 and 26) for the bottom right car due to the transformations not being perfect. The issue arises on the next frame (frame 200) when one of the contours (ID: 25) vanishes and the bottom right car now only has one contour (ID: 26). The smaller radius of 25 doesn't track ID: 25 and is only tracking ID: 26 for that car since the maximum radius of ID: 25 does not contain the centroid of ID: 26. However, the maximum radius of 50 makes it so the tracking algorithm conjoins ID: 25 and 26 to the centroid of ID: 26 since ID: 26 is within the maximum radius of ID: 25. As can be seen in the top left hand corner of the image, frame 200 for the maximum radius of 25 correctly tracks 5 cars while the maximum radius of 50 incorrectly tracks 6 cars. ID: 25 is now conjoined with ID: 26 for the maximum radius of 50 causing an extra car to be tracked. This issue can also occur if the object moves a distance greater than the maximum radius between each frame causing the ID to be conjoined with another ID or a new ID to be created. This example can be seen in the Python OpenCV Juggle Counter: Known Issues section when objects move great distances between frames.

Frame 199 Max Radius 25

Frame 200 Max Radius 25

Frame 199 Max Radius 50

Frame 200 Max Radius 50